





 Shopify
 Stripe
 Slack
Slack Notion
 Google Workspace
 Confluence

Freshdesk Dashboards Explained (2026): Built-in, Team and TV Wallboards, and Why Counts Look Wrong


Freshdesk has three kinds of dashboard: a fixed built-in view, team dashboards a supervisor builds on Pro or Enterprise, and Analytics reports for custom charts. Team dashboards cap at 15 per account and their live widgets refresh within 30 seconds, which makes them workable as a TV wallboard.
Key takeaways
- Freshdesk has three kinds of dashboard: the fixed built-in dashboard, team dashboards a supervisor builds, and Analytics reports for custom chart widgets.
- Freshdesk team dashboards are included only on Pro at $55 and Enterprise at $89 per agent a month billed annually, not on the $19 Growth plan.
- A Freshdesk account can have up to 15 custom dashboards, and each one caps at 15 scorecards, 5 bar charts, 3 CSAT panels and 3 leaderboards.
- Freshdesk live widgets such as scorecards and bar charts refresh from ticket views with a maximum 30-second delay, which keeps a TV wallboard current without manual refreshes.
- A Freshdesk dashboard count that looks too low usually means the role lacks the Access to account-level data on the Dashboard setting or the widget's view excludes tickets.
Freshdesk has three kinds of dashboard: a fixed built-in dashboard every agent lands on, team dashboards a supervisor builds on the Pro ($55) and Enterprise ($89) plans, and Analytics reports for custom charts. An account can hold up to 15 team dashboards, live widgets refresh within 30 seconds, and a team dashboard full of threshold scorecards is what most teams put on a TV wallboard.
| Dashboard type | Who builds it | Plans | Can you change the widgets? |
|---|---|---|---|
| Built-in (My Dashboard, Operations, and others) | Ships with Freshdesk | All plans | No, filter by Group and Product only |
| Team (custom) dashboard | Admin or Supervisor | Pro and Enterprise | Yes, up to 15 scorecards, 5 bar charts, 3 CSAT, 3 leaderboards |
| Analytics report | Anyone with Analytics access | Pro and Enterprise for custom widgets | Yes, any module and metric |
What are the three kinds of dashboard in Freshdesk?
The word gets stretched across three different features, so name them clearly before you build anything.
The built-in dashboard is what an agent sees on login. Per Freshworks' Dashboards in Freshdesk documentation, newer accounts ship with a set of defaults — My Dashboard, an Operations Dashboard, a Knowledge Base Dashboard, Agent Availability, and an Agent Performance Report. These are ready out of the box. You don't build them; you filter them.
Team dashboards (sometimes called custom dashboards) are the ones a supervisor assembles by hand for a specific group or purpose — a queue-health board for Tier 1, say. You pick the widgets, point them at particular ticket views, and share the board with the right people.
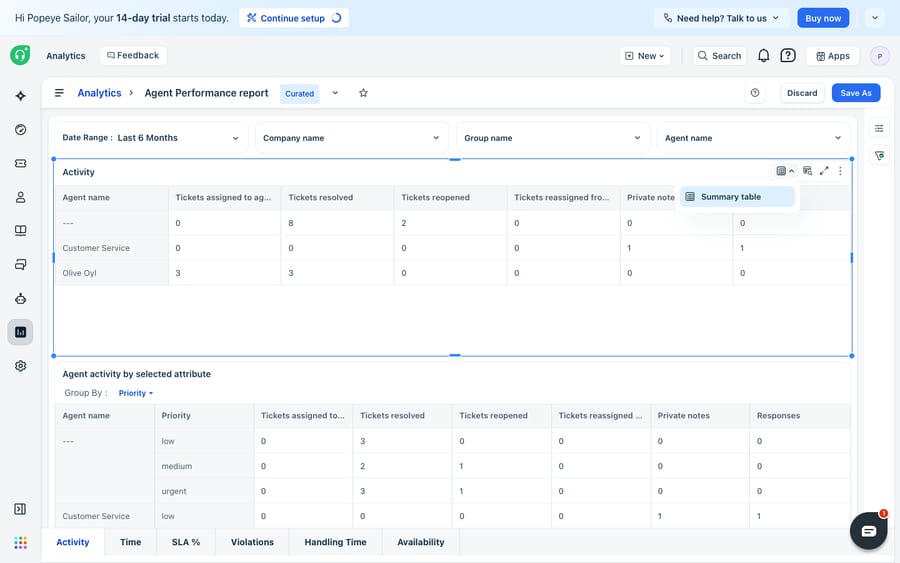
Analytics dashboards are the deeper, report-driven layer, where you build chart widgets from scratch against your ticket data and pin them together. It's a separate surface from the live team dashboards, and it's where curated reports and custom metrics live.
Most teams use all three: the built-in view for day-to-day triage, a team dashboard for real-time queue health, and Analytics for the weekly trend review we cover in Freshdesk custom reports explained.
What does the built-in dashboard show, and what can't you change?
Land in Freshdesk and the default dashboard is doing real work already. The status tiles across the top count your live workload — Unresolved, Overdue, Due today, Open, On hold, and Unassigned. Below that, a Today's trends chart plots incoming ticket volume through the day, and performance widgets surface average first-response time, response time, and a resolution-within-SLA percentage. A CSAT panel shows the positive, neutral and negative split of recent ratings, and a personal to-do list rounds it out.
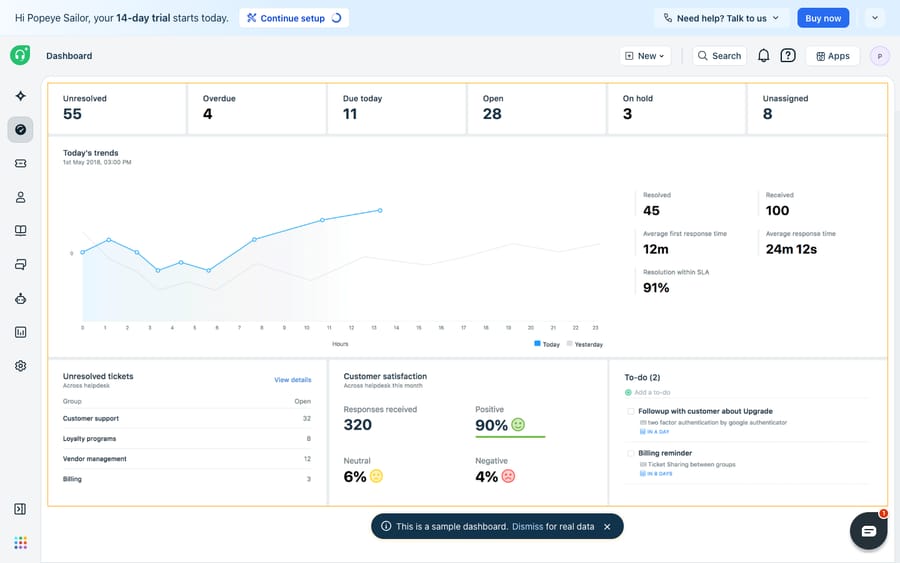
The Operations Dashboard goes further for team leads, adding assignment status (assigned, unassigned, assigned-without-reply, overdue), an SLA summary spanning first-response, every-response and resolution SLAs, and an agent-availability snapshot. It's filterable by group and source, which is enough for many smaller teams to never build a custom board at all.
Here's the constraint people hit first, and Freshworks states it plainly in Can the dashboard in Freshdesk be customized?: the default dashboard's widgets are fixed. You can filter them by Group and Product, and that's it — no adding, removing, or rearranging. If you want a different arrangement, you don't customize the default board, you build a team dashboard instead.
How do you build a team dashboard in Freshdesk?
You'll need Admin or Supervisor access. Per Freshworks' Team Dashboards documentation:
- Open the Dashboard tab, click the hamburger symbol in the top-left corner (the list icon near the dashboard name), then click + New team dashboard.
- Give it a clear, purpose-driven name — "Tier 1 Queue Health" beats "Dashboard 2" every time.
- Drag widgets from the library onto the canvas.
- For each live widget — a Scorecard or a Bar Chart — choose which ticket view it pulls its count from, such as "Unresolved in Billing group."
- Set thresholds on scorecards so a tile changes color when a count crosses a limit. This is the fastest way to make a backing-up queue impossible to miss.
- Add team-performance widgets — a Customer Satisfaction panel and a Leaderboard — if you want productivity and CSAT on the same board.
- Set visibility to All agents or Agents in group, then save.
One admin prerequisite catches people: to surface account-wide numbers rather than just the builder's own tickets, an admin has to enable "Access to account-level data on the Dashboard" for that role. Without it, your scorecards quietly show a narrower slice than you expect — and this is the first thing to check when a count looks too low.
How fresh are live widgets compared with trend widgets?
The widget library splits into two families, and the distinction matters because it changes how fresh the numbers are.
Live widgets pull from your ticket views in near real time, with a refresh delay of at most 30 seconds:
- Scorecard — a single count from a ticket view (Unresolved, Overdue, Due today). Your at-a-glance queue-health number.
- Bar chart — ticket counts broken out by a categorization, so you can see unresolved volume split by group or type.
Trend widgets refresh on their own schedule and are about performance over time rather than the live queue:
- CSAT — customer-satisfaction survey metrics.
- Leaderboard — agent performance and badges, driven by your gamification (Arcade) settings.
Live scorecards and bar charts draw from your ticket views, specifically the global and group-level ones, so a board is only as good as the views behind it — Freshdesk ticket views explained covers building those. CSAT and leaderboard widgets filter by group instead.
How do you arrange, clone and share a dashboard?
A dashboard is only useful if the eye lands on the right number first. Once widgets are on the board you can drag and drop to reorder and resize them to give the important metrics more visual weight. The instinct to copy: live queue-health scorecards across the top where they're seen first, slower trend widgets lower down, since nobody needs to refresh CSAT every thirty seconds.
Visibility is a first-class setting, not an afterthought. All agents opens the board to the whole help desk; Agents in group restricts it, which is how the billing team gets a billing board without cluttering everyone else's dashboard list. You can change the name and visibility at any time via the edit icon next to the dashboard name, and Freshdesk gives you Clone to spin up a variant without rebuilding — worth using before you experiment, because Delete is permanent.
If you need genuinely bespoke charts — a custom metric, a specific chart type, a filtered slice the standard widgets don't offer — that lives in Analytics, not the team-dashboard builder. Per Build your own chart widgets in Analytics, you open Analytics → New Report, give it a title, set its visibility and click Create; then add a Chart from the New section, pick the module and the exact metrics you want, and save. A saved widget becomes a reusable template under the Existing section of the library.
How do you run a Freshdesk dashboard as a TV wallboard?
A "wallboard" in Freshdesk isn't a separate product — it's a team dashboard built mostly from live scorecards and bar charts with color thresholds, thrown up on a shared monitor so the whole floor sees the same queue health. It works because the live widgets refresh in near real time, with a documented maximum 30-second delay, so the board stays honest without anyone hitting refresh.
What to put on it, in rough order of usefulness on a screen ten feet away:
- Three or four threshold scorecards, nothing more. Unresolved, Overdue, Unassigned, and one SLA number. A red tile reads across a room in a way a line graph never will, so the thresholds do more work than any chart you could add.
- One bar chart splitting unresolved volume by group, so the room can see where the backlog is, not just that there is one.
- The announcement banner. You can post a short note on the board — capped at 150 characters — for a shift handover or an incident heads-up.
- The leaderboard, if it fits your culture. It ranks agents across four badges — Most Valuable Player, Customer Wow Champion, Sharpshooter, Speed Racer. Some teams love it on a wallboard; others find it gimmicky. Skip it rather than force it.
Three practical notes for a genuinely always-on screen. Browsers time out and sessions expire, so set up a dedicated kiosk login rather than leaving someone's personal session running. Build the board against group-level views so it keeps working when the person who made it is on leave. And remember the account-level-data role setting above — a wallboard showing one agent's slice of the queue is worse than no wallboard.
If the native widgets aren't rich enough for a display wall, the marketplace has options: Geckoboard and Klipfolio both pull Freshdesk data onto external wallboards. They still only show the queue, but they give you more control over how it looks on a big screen.
Which plans include team dashboards, and what are the limits?
Plan gating is the big one. Team and custom dashboards — and the custom chart widgets you'd build in Analytics — are gated to Pro and Enterprise (the legacy Estate and Forest tiers), on both Freshdesk and Freshdesk Omni. Growth doesn't include them, so on the entry plan the built-in dashboards and their Group/Product filters are all you get. Growth is the entry plan now: the pricing page lists no free plan and publishes Growth at $19, Pro at $55 and Enterprise at $89 per agent a month billed annually, with a 14-day trial of Enterprise (checked 24 September 2026). Freshworks does run a Free program covering up to 2 agents for 6 months, but that is time-limited, not a free plan, so older guidance about a permanent "Free" tier is out of date.
The hard limits are modest. An account can have a maximum of 15 custom dashboards, and each dashboard caps widgets by type: 15 scorecards, 5 bar charts, 3 CSAT panels, and 3 leaderboards. That's plenty for a focused board and it rules out one sprawling mega-dashboard that tries to show everything. Treat dashboards as a resource to curate — one solid board per team beats a graveyard of half-built ones.
Why do the dashboard numbers look wrong?
Two complaints dominate the community threads about Freshdesk dashboards, and neither is really a bug in the dashboard.
The open-ticket count doesn't match the ticket list
This is the most common version (577 views): the tile says one number, the list says another. Work through it in this order.
- Check the role setting. "Access to account-level data on the Dashboard" is the single most common cause of a count that's too low — without it you're seeing one person's slice.
- Check which view the widget points at. A live scorecard counts a view, so if that view's conditions exclude a group, a source or a custom status, the tile faithfully excludes them too. Custom statuses are a frequent culprit, because a ticket parked in "Waiting on third party" isn't Open.
- Check the age of the tickets you're missing. A contributor on that thread reports that the All Open view surfaces only tickets from roughly the last six months, and suggests All Unresolved as the filter that gives an accurate active count. That's a community observation rather than something Freshworks documents, so treat it as a diagnosis to test rather than a specification — but if your missing tickets are all old, it's the first thing to check.
- Then raise it with support. The original poster's discrepancy was resolved through Freshworks support, which points at a backend data issue rather than anything configurable. If steps 1–3 come up clean, it's not your configuration.
There's no "last modified" column
The second-most-read thread (1,044 views) asks for a last-modified-date column in the ticket dashboard's table view, so you can see when tickets were last touched without opening each one. The answer, four years on, is that it isn't there — moderators point people at the Freshworks Ideas forum to upvote it, and a 2026 comment on the thread notes it still hasn't shipped. The customizable table view lets agents pick which fields they see, but last-modified isn't among the fields on offer.
The practical substitute: build a view or a scorecard on the time-based conditions the automation engine already exposes — hours since an agent responded, hours since the customer responded — and point a threshold scorecard at it. That surfaces "nothing has happened here in two days" as a colored tile, which is what people actually want the column for.
Can a dashboard clear the queue, and where does an AI layer fit?
Freshdesk's dashboards are genuinely capable, and for real-time queue monitoring the native experience is hard to beat. But the deeper point is simple: a dashboard measures and displays, it does not act. It will faithfully show you 40 overdue tickets and an SLA sliding toward breach, but it can't read those tickets, understand what each customer needs, and start clearing them. Every number on the board is the output of work your agents still do by hand. The dashboard is a mirror, not a mechanism.
That gap is where an AI agent layer fits, and the category of AI agents for customer service exists to do the reasoning-heavy work a metric tile can't. Macha is one: it runs on top of the Freshdesk you already use as a native connector. It doesn't replace your help desk, its dashboards or its reports. You connect it with your subdomain and API key, and it works the same tickets your dashboards count: drafting or posting grounded replies so the Unresolved and Overdue tiles actually shrink, triaging by intent so tickets are routed before they age, and looking up order or account status through a custom tool that turns one of your REST APIs into something the agent can call. The connector is for Freshdesk specifically, not Freshchat, Freshservice or Freshcaller. Pricing is one plan on monthly ticket volume, from $299 a month for 750 tickets — about $0.40 a ticket at every tier, with setup and monitoring by the Macha team included and $50 of free usage to try it. There's a fuller walkthrough in how to automate Freshdesk with AI.
The clean division of labour: let Freshdesk's dashboards stay the live source of truth for what the queue looks like right now, and layer an agent on top for the part the tiles can't do — working the tickets down so the board turns green.
Frequently asked questions
What are the different dashboards in Freshdesk? Three broad kinds. The built-in dashboards (My Dashboard, Operations, Knowledge Base, Agent Availability, Agent Performance) ship ready to use. Team or custom dashboards are ones a supervisor builds by hand for a specific group. Analytics dashboards are the deeper, report-driven layer where you build chart widgets from your ticket data.
Can the default Freshdesk dashboard be customized? No. Its widgets are fixed — you can filter them by Group and Product, but you can't add, remove or rearrange them. To arrange your own widgets you create a Team Dashboard instead.
How do I create a team dashboard in Freshdesk? As an Admin or Supervisor, open the Dashboard tab, click the hamburger symbol in the top-left, and choose + New team dashboard. Name it, drag widgets onto the canvas, point each live widget at a ticket view, set thresholds, and choose whether it's visible to all agents or just a group.
How many custom dashboards and widgets can I have? Up to 15 custom dashboards per account, and per board up to 15 scorecards, 5 bar charts, 3 CSAT panels and 3 leaderboards.
Which plans include team and custom dashboards? Pro and Enterprise (and the legacy Estate and Forest tiers), on both Freshdesk and Freshdesk Omni. Growth, the entry plan now that the pricing page lists no free plan, gets the built-in dashboards and their filters but not the custom builder.
Can I use a Freshdesk dashboard as a TV wallboard? Yes. Build a team dashboard from live scorecards and bar charts with color thresholds and display it on a shared monitor — the live widgets refresh within about 30 seconds, so the board stays current on its own. Use a dedicated kiosk login so the session doesn't time out, and build it on group-level views so it survives the person who made it going on leave.
What should I put on a Freshdesk wallboard? Three or four threshold scorecards (Unresolved, Overdue, Unassigned, one SLA figure), one bar chart splitting the backlog by group, and the 150-character announcement banner for shift notes. Colour thresholds do more work than any chart at a distance. Add the leaderboard only if that suits your team's culture.
Why is the number of open tickets on my dashboard wrong? Usually the widget and the list aren't counting the same thing. Check that the role has "Access to account-level data on the Dashboard" enabled; check which ticket view the scorecard points at, since custom statuses and group conditions silently exclude tickets; and if the tickets you're missing are old, try the All Unresolved filter — a community contributor reports All Open surfacing only roughly the last six months, which isn't documented by Freshworks but is worth testing. If none of that explains it, raise it with support, which is how the community thread's original case was resolved.
Can I see a last-modified date on the Freshdesk ticket dashboard? Not as a column — it's been an open community request since 2022 and a 2026 comment on the thread confirms it still hasn't shipped. The workable substitute is a view or threshold scorecard built on time-based conditions such as hours since an agent responded, which surfaces stale tickets as a colored tile.
Where do I build custom chart widgets? In Analytics, not the team-dashboard builder: Analytics → New Report, title it, set visibility, Create, then add a Chart from the New section, pick the module and metrics, and save. Saved widgets become reusable templates under Existing. This sits on Pro and Enterprise.
Can I add AI to Freshdesk without replacing my dashboards? Yes. An AI agent layer like Macha connects to Freshdesk as a native connector and runs on top of your existing help desk, dashboards and reports — it doesn't replace them. It helps move the numbers your dashboards track by triaging and drafting grounded replies, while Freshdesk stays the system of record.
What should a Freshdesk dashboard setup look like?
Freshdesk gives you a fixed built-in dashboard you can filter but not rearrange, team dashboards you build yourself on Pro and Enterprise, and an Analytics layer for bespoke charts. For a TV wallboard, the recipe is three or four threshold scorecards on group-level views, one bar chart, a kiosk login, and the discipline not to add a fifth tile. Keep the caps in mind — 15 dashboards, 15 scorecards a board — and when a count looks wrong, check the role's account-level-data setting and the view behind the widget before you assume it's broken. And when the tiles are red because the queue is genuinely full, start a trial of an agent layer that works the tickets down rather than counting them.
Widget limits, refresh behaviour, plan gating and admin paths verified against Freshdesk support articles 50000011779, 234371, 50000001714 and 50000001158 (20 September 2026); team-dashboard limits and the Freshworks pricing page re-checked 24 September 2026. The dashboard screenshot shows Freshdesk's built-in sample board on a trial account, so the figures in it are demo data.
Sources: Dashboards in Freshdesk, Team Dashboards — setup and functionality, Can the dashboard in Freshdesk be customized?, Build your own chart widgets in Analytics, Freshdesk pricing, Number of open tickets on dashboard is wrong (Freshworks community), Last modified date on ticket dashboard (Freshworks community).