





 Shopify
 Stripe
 Slack
Slack Notion
 Google Workspace
 Confluence

Which Freshdesk Plans Have Custom Reports? Widgets, Metrics and Limits (2026)


Freshdesk custom reports are drag-and-drop canvases of up to 36 widgets, and only the Pro and Enterprise plans can build, schedule or export them. Growth can save and clone the curated reports, and every plan below Pro is limited to two years of reporting history.
Key takeaways
- Freshdesk custom reports are available only on the Pro and Enterprise plans; Growth can save and clone curated reports but cannot build, schedule or export custom ones.
- A single Freshdesk report canvas holds up to 36 widgets, built from four types: Chart, Interactive Filter, Text and Image.
- Freshdesk plans other than Pro and Enterprise can report on only the most recent two years of data, while Pro and Enterprise have no reporting-duration limit.
- Since 31 May 2026, every Freshdesk Analytics report must carry a defined date range, and reports without one were capped or had to be fixed by hand.
- Freshdesk curated reports cannot be scheduled, so a team wanting a recurring email clones the curated report into a custom one and schedules it from the Export icon.

Freshdesk custom reports are canvases of up to 36 widgets that you build in Freshdesk Analytics, and they are available only on the Pro and Enterprise plans (Freshworks' Analytics features for each plan, checked 24 September 2026). Growth can save and clone curated reports but can't build, schedule or export custom ones.
| Analytics feature | Free | Growth | Pro | Enterprise |
|---|---|---|---|---|
| Curated reports (view) | Yes | Yes | Yes | Yes |
| Save and clone reports | No | Yes | Yes | Yes |
| Custom reports | No | No | Yes | Yes |
| Schedule and export | No | No | Yes | Yes |
| Reporting history | 2 years | 2 years | Unlimited | Unlimited |
What's the difference between curated and custom reports in Freshdesk?
Freshdesk Analytics splits into two worlds. Curated reports are the pre-built ones that Freshworks maintains. The plan-features page lists Agent Performance, Performance, Session Usage and Resolution & Response Time on every plan, with Adoption and Satisfaction Survey reports added on Pro and Enterprise. Custom reports are the blank canvases you build yourself, widget by widget.
The dividing line is plan-gated. Per Freshworks' Analytics features for each plan documentation, saving and cloning a report needs Growth or above, and custom reporting is restricted to Pro and Enterprise, alongside scheduling, export and three-level drill-down into the underlying data. So if the "New Report" button feels missing, the account is usually on Growth. (Freshdesk's pricing page no longer lists a free plan; Freshworks runs a Free program for up to 2 agents for 6 months instead, and the Analytics documentation still shows a Free column.)
One practical consequence: you can't add new widgets to a curated report directly. If a curated report is almost right but missing a chart, clone it into a custom report and edit the copy. Most teams start that way rather than building from zero.
What is a Freshdesk custom report made of?
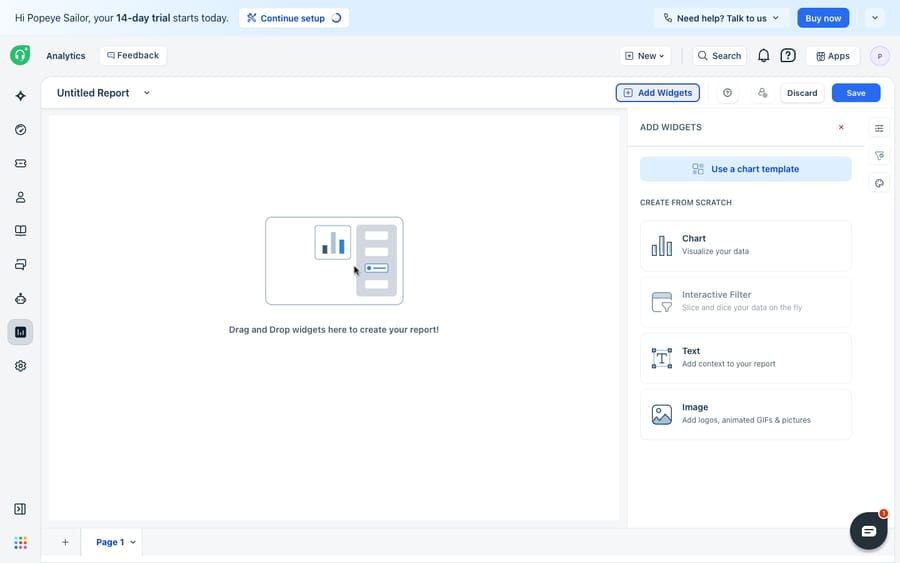
A custom report in Freshdesk is a canvas you fill with widgets. Per the Custom Reporting Basics documentation, you can build four widget types from scratch:
- Chart: the workhorse, a visualization (bar, line, pie and so on) driven by the metrics you choose.
- Interactive Filter: a control on the report itself that lets a viewer slice the data live (by group or date, say) without editing the report.
- Text: a heading or note, so a report reads as a narrative rather than a wall of charts.
- Image: a logo or reference image, mostly for reports you'll export and share.
Pre-built widgets sit across five modules: Tickets, Timesheets, Surveys, Survey Results and Articles. You can add up to 36 widgets to a single report canvas, and the documentation describes resizing a widget by dragging its bottom-right corner. Thirty-six is room for a dense operational dashboard, though past a dozen or so widgets most teams find a second, focused report reads better than one sprawling page.
How do you build a chart widget from scratch?
Here's the end-to-end flow for the widget you'll build most often, a chart driven by your own metric. Per Freshworks' Build your own chart widgets in Analytics guide:
- From the Analytics homepage, click New Report. Give it a title, set visibility (private to you, or shared), and click Create.
- On the canvas, choose Chart from the widget options (or start from a chart template if one is close to what you need).
- Pick the module, the data source such as Tickets, that the widget draws from.
- In the configuration pane on the right, enter your metric (what you're counting or measuring) and, where relevant, a group-by dimension (what you're splitting it across).
- Apply any filters to narrow the rows: a priority, a group, a date range.
- Click Apply, then Save. A saved widget becomes a reusable template under the Existing section of the widget library, so you can drop the same chart into other reports without rebuilding it.
That reuse is where the time goes back. Build "tickets resolved within SLA, by group" once, and it's a one-drag addition to every future report.
What do the main Freshdesk metrics mean?
Half the work with custom reports is knowing what each metric means before you chart it. The common ones:
- First response time: how long from ticket creation until an agent's first reply. The headline "are we fast?" number.
- Resolution time: how long from creation until the ticket is resolved. Often reported as an average and as a median; the median is usually the more honest figure, since one nightmare ticket can drag the average.
- First contact resolution (FCR): the share of tickets solved in a single reply, with no back-and-forth. A proxy for answer quality.
- Tickets created / received: raw inbound volume, usually charted over time to spot spikes and seasonality.
- Backlog / unresolved tickets: the open pile at a point in time. Rising backlog with flat volume means throughput is slipping.
- SLA % achieved: the share of tickets that hit their response or resolution target. Ties your analytics straight back to your SLA policies.
- Reassignments / reopens: how often tickets bounce between agents or get reopened after being marked resolved. High numbers hint at routing or root-cause problems.
- CSAT: customer satisfaction from survey responses, typically the percentage of positive ratings.
A warning on time-based metrics: whether they count around the clock or only during your working calendar depends on your business-hours setup, which is a frequent source of "these numbers look wrong" confusion. See Freshdesk business hours explained if a metric is reading oddly.
How do you schedule and export a Freshdesk report?
A report nobody opens is wasted work, so the last mile is delivery. On Pro and Enterprise, you can schedule a custom report to email itself out on a cadence. Per the Can I schedule a report in Analytics? documentation, you open the custom report, click the Export icon at the top right, choose Schedule Report, set the cadence, delivery time, subject and description, add recipient email addresses under Send to, and click Save.
Two caveats worth knowing up front:
- Curated reports can't be scheduled, only custom reports can. If you want a weekly resolution-time email, clone the curated report into a custom one first.
- Scheduling and export both sit behind Pro/Enterprise, at report level and widget level. On Growth you can view, save and clone, but not schedule or export.
Where does Freshdesk's native analytics run out?
Freshdesk Analytics is a capable self-serve BI tool for support data, and for most teams it answers the operational questions well. The edges are worth knowing.
It's plan-gated in ways that bite. Custom reports, scheduling and export are Pro-and-above features, so a Growth team is limited to curated reports plus save and clone. Per the Analytics usage limits documentation, plans other than Pro and Enterprise can report on only the most recent two years of data, while Pro and Enterprise have no limit on reporting duration. Since 31 May 2026, every report must carry a defined date range: on the capped plans, reports without one were set to the two-year maximum, and on Pro and Enterprise, reports without one had to be fixed by hand or moved to Trash.
It reports on Freshdesk data only. If part of your customer story lives in Shopify orders, a billing system or a product database, the native analytics can't join to it. You export to a spreadsheet or a warehouse and stitch it together yourself.
And it's descriptive, not active. A custom report can tell you the backlog grew 18% and first-response time slipped on Tuesdays, but it doesn't touch the backlog. Every insight still lands on a human who has to do the work the chart is recommending.
That gap is where an AI agent layer fits, and it helps to understand the build-versus-buy shape of that category before reaching for one. Macha is one such layer: it runs on top of the Freshdesk you already use as a native connector and doesn't replace your help desk or its analytics. You connect Macha to Freshdesk with your subdomain and API key, and it reads and writes the same tickets your reports count: drafting or posting grounded replies, triaging by intent, and looking up order or account status through a custom tool that turns a REST API into something an agent can call. Keep Freshdesk Analytics as your record of what happened, and put an agent on top to act on it; that's the practical route to automating Freshdesk with AI so the metrics you track actually move. Macha's connector is for Freshdesk specifically, not Freshchat, Freshservice or Freshcaller. Billing is per ticket, not per resolution: one plan priced by volume, from $299 a month for up to 750 tickets, with setup by the Macha team included (see pricing).
FAQ
Where do I build custom reports in Freshdesk? In Freshdesk Analytics. From the Analytics homepage click New Report, give it a title and visibility, click Create, then drag widgets (Chart, Interactive Filter, Text, Image) onto the canvas and configure each one's metrics in the right-hand pane.
What plan do I need for custom reports? Pro or Enterprise. Growth can save and clone curated reports but can't create custom ones. Scheduling and export are also Pro and Enterprise features.
What's the difference between curated and custom reports? Curated reports are pre-built and maintained by Freshworks (Agent Performance, Resolution & Response Time and so on). Custom reports are built by you from a blank canvas. You can't add widgets to a curated report directly, so clone it into a custom report and edit the copy.
How many widgets can a Freshdesk report hold? Up to 36 widgets on a single report canvas. Saved widgets become reusable templates under the Existing section of the widget library.
Can I schedule a Freshdesk report to email automatically? Yes, on Pro and Enterprise. Open a custom report, click the Export icon, choose Schedule Report, and set the cadence, time, subject and recipients. Curated reports can't be scheduled, only custom ones.
How far back can Freshdesk reports go? On Pro and Enterprise there's no limit on reporting duration. On other plans you can report on the most recent two years of data, and since 31 May 2026 every report needs a defined date range.
Want your Freshdesk metrics to improve, not just get measured? Start a free trial of Macha and connect it to your Freshdesk in minutes.