



 Shopify
 Stripe
 Slack
Slack Notion
 Google Workspace
 Confluence

How to Customize Your Freshdesk Dashboard


Freshdesk ships with a default dashboard the moment you log in, but it's a one-size-fits-all view — a fixed set of tiles you can filter but not rearrange. The moment you have more than one team, or a manager who only cares about SLA breaches while a lead cares about CSAT, that default view starts to feel like a compromise. The fix is a custom team dashboard: your own arrangement of widgets, scoped to the metrics a specific group actually needs, and shared with exactly the people who should see it. This guide walks through building one from scratch — adding and arranging widgets, setting filters, and sharing it with a group — and stays honest about which parts are gated to higher plans and where the native tooling runs out of road.

Default dashboard vs. custom dashboard
Before you customize anything, it helps to know the two things Freshdesk calls a "dashboard," because they behave very differently. Per Freshworks' own Can the dashboard in Freshdesk be customized? documentation, the default dashboard gives you an overall view of the whole helpdesk's KPIs, and "these widgets are fixed" — you can filter them by Group and Product, but you cannot add, remove, or rearrange them.
The customizable layer is what Freshdesk calls Team Dashboards. This is where you pick your own widgets, arrange them, name the board, and decide who can see it. If you want a fuller tour of what the standard board shows out of the box, we broke it down in Freshdesk dashboards explained. The rest of this guide is about the custom side.
One thing to check first: Team Dashboards are plan-gated. They're available on the current Pro and Enterprise plans (and the legacy Estate and Forest tiers). If you're on Growth or a lower plan, you'll have the default dashboard and filters, but not the custom-dashboard builder described below.
Step 1: Create a new team dashboard
Everything starts from the Dashboard tab. Per Freshworks' Team Dashboards — Setup and Functionality guide, you'll need Admin or Supervisor access.
- Log in as an Admin or Supervisor and open the Dashboard tab.
- Click the hamburger menu (the list icon near the dashboard name).
- Select + New team dashboard.
- Give the dashboard a clear, purpose-driven name — "Tier 1 Queue Health" beats "Dashboard 2" every time.
- Set the visibility (covered in Step 4) and create the board.
Worth knowing up front: an account can hold a maximum of 15 custom dashboards. That's usually plenty, but it means dashboards are a resource to curate, not spin up endlessly — one solid board per team beats a graveyard of half-built ones.
Step 2: Add widgets
With an empty board open, you build it up widget by widget. Freshdesk offers two broad families, and the distinction matters because it changes how fresh the numbers are.
Live widgets pull from your ticket views in near-real time, with a refresh delay of at most 30 seconds:
- Scorecard — a single count from a ticket view (e.g. "Unresolved," "Overdue," "Due today"). This is your at-a-glance queue-health number.
- Bar chart — ticket counts broken out by a categorization, so you can see, say, unresolved volume split by group or type.
Trend widgets refresh on their own schedule and are about performance over time rather than the live queue:
- CSAT — customer-satisfaction survey metrics.
- Leaderboard — agent performance and badges, driven by your gamification (Arcade) settings.
To add one, name the widget and choose its source. Live scorecards and bar charts draw from your ticket views — specifically the global and group-level views — while CSAT and leaderboard widgets filter by group. Each board has per-type limits: up to 15 scorecards, 5 bar charts, 3 CSAT widgets, and 3 leaderboards, so plan the layout around the handful of numbers that actually drive a decision.
Step 3: Arrange and resize widgets
A dashboard is only useful if the eye lands on the right number first. Once your widgets are on the board, you can drag and drop them to reorder the layout and resize them to give the important metrics more visual weight. The instinct to copy: put the live queue-health scorecards (Unresolved, Overdue, Due today) across the top where they're seen first, and push the slower trend widgets — CSAT, leaderboards — lower down, since nobody needs to refresh those every thirty seconds.
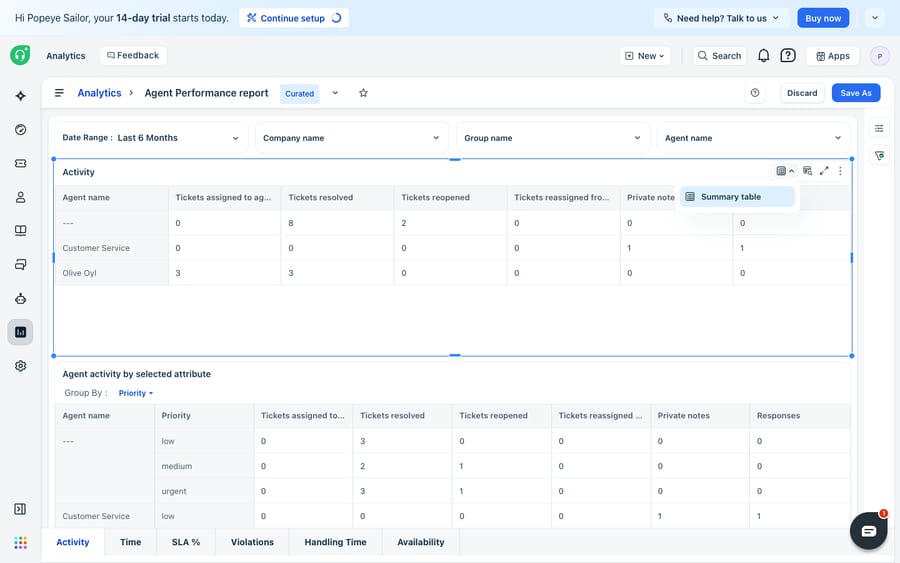
If you need genuinely bespoke charts — a custom metric, a specific chart type, a filtered slice that the standard widgets don't offer — that lives in Analytics, not the team-dashboard builder. Per Freshworks' Build your own chart widgets in Analytics guide, you open Analytics → New Report, give it a title, set its visibility, and click Create; then add a Chart from the New section, pick the module and the exact metric(s) you want, and save. A saved widget becomes a reusable template you'll find under the Existing section of the library. This deeper reporting is available on Pro and Enterprise (on both Freshdesk and Freshdesk Omni).
Step 4: Share the dashboard with a group
The whole point of a custom dashboard is that the right people see the right numbers — so visibility is a first-class setting, not an afterthought. When you create (or later edit) a team dashboard, you choose between two visibility options:
- All agents — everyone in the helpdesk can open the board.
- Agents in group — only members of a chosen group see it, which is how you give the billing team a billing board and the Tier 1 queue its own queue-health view without cluttering everyone else's dashboard list.
You can change the name and visibility at any time via the edit icon next to the dashboard name. Freshdesk also gives you Clone (to spin up a variant of an existing board without rebuilding it) and Delete — noting that deletion is permanent and can't be undone, so clone before you experiment.
Where the native dashboard stops
Freshdesk's dashboards are genuinely solid: live scorecards, drag-and-drop arrangement, and group-scoped sharing cover most of what a support team needs to run its day. But it's worth being clear-eyed about the edges.
It's plan-gated. Custom team dashboards and Analytics report-building both sit on Pro and Enterprise. On lower plans you get the fixed default dashboard and its Group/Product filters — informative, but not customizable.
There are hard limits. Fifteen custom dashboards per account, and per-board caps of 15 scorecards, 5 bar charts, 3 CSAT widgets, and 3 leaderboards. For most teams that's fine; for a large multi-brand operation it can feel tight.
And — most importantly — a dashboard reports, it doesn't act. A scorecard can tell you there are 40 tickets in "Overdue," but it can't read those tickets, understand what they're about, or start clearing them. Every number on the board is the output of work your agents still have to do by hand. The dashboard is a mirror, not a mechanism.
This is the seam where an AI agent layer fits — and it's a genuine build-vs-buy question, one we weigh in building an AI agent from scratch vs. a platform. The broader category of AI agents for customer service exists to do the reasoning-heavy work a metric tile can't: reading a ticket and drafting the reply, not just counting how many are waiting.
Macha is one such layer. It runs on top of the Freshdesk you already use as a native connector — it does not replace your help desk, your dashboards, or your reports. You connect Macha to Freshdesk with your subdomain and API key, and it works the same tickets your dashboards count: triaging by intent, drafting or posting grounded replies, and looking up order or account status through a custom tool that turns a REST API into something the agent can call. The clean division of labour is to keep Freshdesk's dashboards as the source of truth for what's happening, and layer an agent on top to actually move those numbers — which is the whole idea behind automating Freshdesk with AI. (Macha's connector is for Freshdesk specifically — not Freshchat, Freshservice, or Freshcaller. And credits are consumed per AI action, not per resolution — see the pricing breakdown.)
FAQ
Can the default Freshdesk dashboard be customized? No. The default dashboard's widgets are fixed — you can filter them by Group and Product, but you can't add, remove, or rearrange them. To customize widgets you create a Team Dashboard instead.
How do I create a custom dashboard in Freshdesk? As an Admin or Supervisor, open the Dashboard tab, click the hamburger menu, and choose + New team dashboard. Name it, set its visibility, then add and arrange your widgets. Note that Team Dashboards are available on the Pro and Enterprise plans (and legacy Estate/Forest).
How many widgets and dashboards can I have? An account can hold up to 15 custom dashboards. Each dashboard supports up to 15 scorecards, 5 bar charts, 3 CSAT widgets, and 3 leaderboards.
How do I share a Freshdesk dashboard with a specific group? When creating or editing the dashboard, set its visibility to Agents in group and pick the group. Choose All agents instead if everyone should see it. You can change visibility later via the edit icon next to the dashboard name.
Can I add AI to Freshdesk without replacing my dashboards? Yes. An AI agent layer like Macha connects to Freshdesk as a native connector and runs on top of your existing help desk, dashboards, and reports — it doesn't replace them. It helps move the numbers your dashboards track by triaging and drafting grounded replies, while Freshdesk stays the system of record.
Ready to turn the numbers on your dashboard from a status report into a to-do list that clears itself? Start a free trial of Macha and connect it to your Freshdesk in minutes.
Add AI agents to your Freshdesk
Macha reads the ticket, drafts the reply and takes the action, inside the Freshdesk you already run.