
 Intercom
 Shopify
 Stripe
 Slack
Slack Notion
 Google Workspace
 Confluence

Is Gorgias Down? How to Read the Status Page and Its Outage History (2026)


Go to status.gorgias.com and read the specific component you use, not the banner at the top. Gorgias publishes 77 components across seven groups, so the platform can read operational while WhatsApp, one cluster or the Shopify integration is not.
Key takeaways
- Gorgias publishes 77 status components across seven groups on status.gorgias.com, so the whole platform can read operational while one channel like WhatsApp is down.
- Gorgias logged 46 incidents in the 180 days before 21 September 2026, with a median duration of 74 minutes and 30 of the 46 resolved within two hours.
- The longest Gorgias incident in that window ran about 51 hours, a store website and URL sync failure from 15 to 17 July 2026.
- The only incident Gorgias rated critical in 180 days was a chat outage on 22 June 2026, which makes chat the channel with the worst recent incident.
- When Shopify has a problem, the Gorgias customer sidebar and order actions fail while Gorgias itself stays operational, so check shopifystatus.com before declaring an outage.
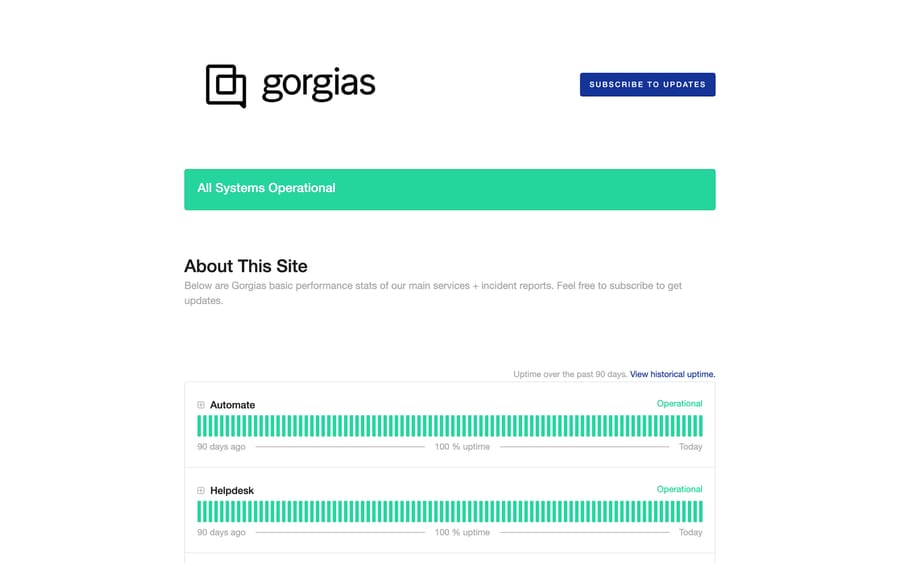
To see whether Gorgias is down, open status.gorgias.com and read the component you use, not the banner: the page tracks 77 components in seven groups, so WhatsApp, one cluster or the Shopify integration can fail while the help desk is fine. When we checked on 21 September 2026 the page read All Systems Operational, and it still did on a recheck on 24 September. It also listed 46 incidents in the previous 180 days, which tells you something useful: most Gorgias incidents are narrow and short, not "Gorgias is down".
How do you check if Gorgias is down in 30 seconds?
- Open status.gorgias.com.
- Find the group that matches what is broken — Helpdesk if the app will not load, Helpdesk Integrations if one channel is failing, Helpdesk Clusters if things are slow, Automate if the AI Agent or Flows are misbehaving.
- Read that component's state, then scan the incident feed underneath for anything open.
- If everything you use is green, the problem is probably on your side or on Shopify's. Skip to the elimination ladder below.
What do the seven groups on the Gorgias status page cover?
This is where most "is Gorgias down" pages stop at a banner. The groups, read from Gorgias's own status API on 21 September 2026:
| Group | Components | What is in it |
|---|---|---|
| Automate | 3 | AI Agent, Flows, Order Management |
| Helpdesk | 3 | REST API, Web App, Mobile Apps |
| Helpdesk Integrations | 24 | Email, the four Mailgun components, Gmail, Outlook, Live Chat, Smooch Core API, Shopify integration, Shopify API & Mobile, ReCharge, Stripe API, Aircall, Yotpo, Native Phone, SMS, WhatsApp, Twitter, and the Facebook and Instagram channels |
| Helpdesk Clusters | 11 | Named clusters such as us-east1-635c, us-central1-d8ff, europe-west3-86c1, aus-southeast1-fcb9 |
| Help Center | 3 | REST API, Customer Help Center website, Custom Domains |
| Infrastructure & Cloud | 8 | Google Cloud components — GKE, Compute Engine, Cloud Storage, Cloud SQL, Pub/Sub, Networking, DNS |
| Convert | 1 | Campaigns |
Outside the groups there is a standalone Website component and a block of Chargebee components — Chargebee is Gorgias's billing platform, and those rows are a mirror of Chargebee's own status. If the only red on the page is Chargebee, your help desk is fine and your invoices are late.
Three practical consequences of that map:
Integrations is the biggest group by far, at 24 of the 77 components, and it is where most of what breaks actually breaks. Email failures usually show as a Mailgun component rather than as "Helpdesk". A dead chat widget shows as Live Chat or Smooch Core API, not as Web App.
Clusters are named, not regional. Gorgias's own July incident title reads "Realtime updates lagging on us-cental-d8ff cluster" — a specific cluster, one of eleven. An incident on a cluster you are not on is a non-event for you. Gorgias does not publish which cluster an account sits on, so if it matters, ask support before you need to know rather than during an incident.
Infrastructure is Google Cloud. Eight of the components are GCP services Gorgias runs on. When those go red, Gorgias is a victim rather than a cause, and the fix timeline is not Gorgias's to set.
The page also shows two live metrics under System Metrics: Background Tasks Duration (average) and REST API Response Latency (average). When we read it they were 3.9 seconds and 100 ms. Those are the fastest way to confirm "everything is slow but nothing is officially broken" — which is a real state, and the one most likely to make your team argue.
What do the Gorgias status states mean?
Gorgias's page runs on Atlassian Statuspage, so the states are the standard set:
| State | What it means |
|---|---|
| Operational | Performing normally |
| Degraded Performance | Slow or flaky, mostly working |
| Partial Outage | Down for some users or some regions |
| Major Outage | Fully unavailable |
| Maintenance | A planned window, not a fault |
"Degraded" is not "down", and "partial" means the problem is scoped — usually to a cluster or a channel. Before you escalate, check whether what you are seeing is a scheduled maintenance window posted in advance on the same page.
Why does the status page show 100% uptime when there were incidents?
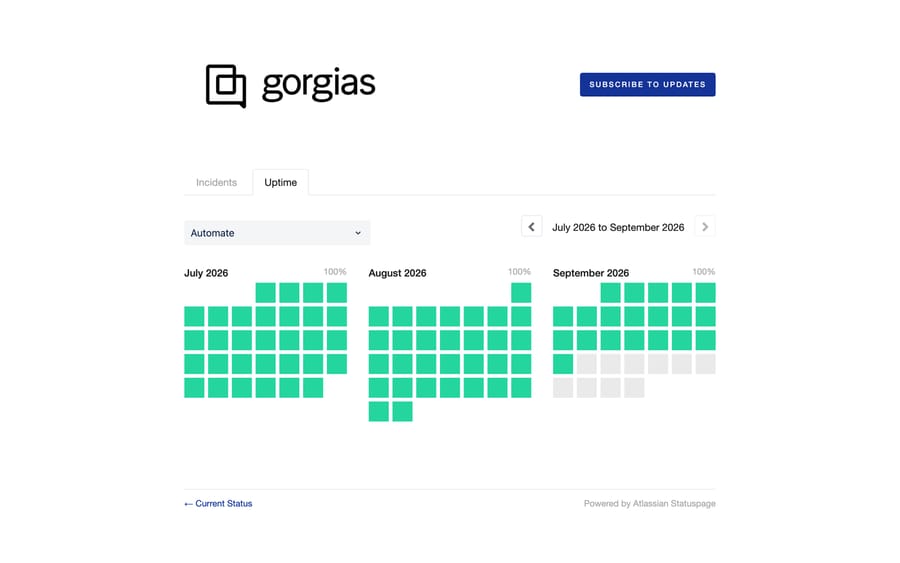
On the day we looked, every top-level group showed 100% uptime over the past 90 days — while the incident feed for the same 90 days listed 24 incidents.
Both are true. Statuspage computes uptime per component and rounds it, and most Gorgias incidents hit one sub-component for under two hours, which rounds away at the group level. So use the uptime bars for long-term trend and the incident history for "has this been happening a lot lately". If you are evaluating Gorgias on reliability, the incident feed is the honest document.
How often does Gorgias have incidents?
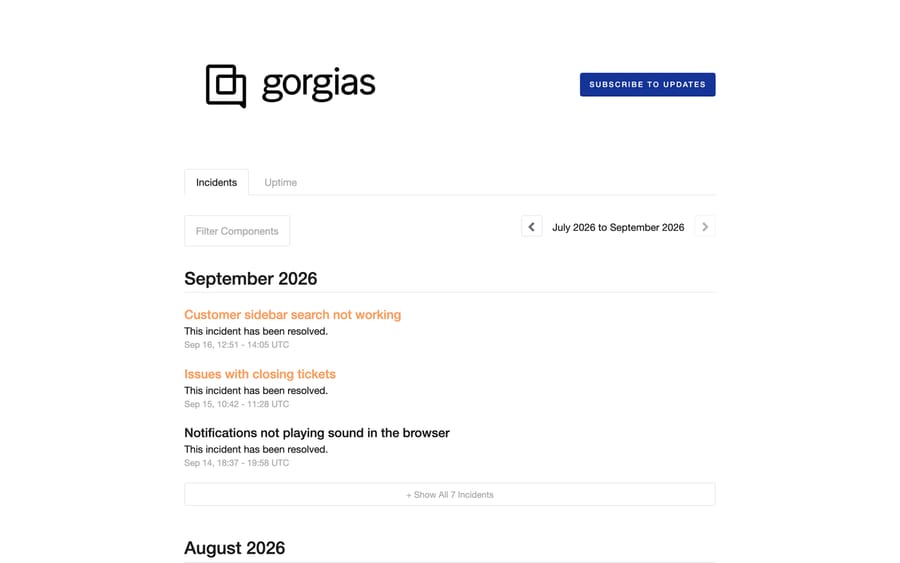
Read from Gorgias's public incident feed on 21 September 2026, covering the previous 180 days:
- 46 incidents, of which 24 fell in the last 90 days.
- By severity: 1 critical, 30 major, 11 minor, 4 informational.
- Median duration 74 minutes. 30 of the 46 were resolved inside two hours.
- The longest ran about 51 hours — "Store website and URLs sync failures", 15 to 17 July 2026.
- By month: 7 in April, 7 in May, 10 in June, 10 in July, 3 in August, 7 in September to the 21st.
A representative recent run, with Gorgias's own titles and UTC windows:
| Date | Incident | Window |
|---|---|---|
| 16 Sep 2026 | Customer sidebar search not working | 12:51-14:05 |
| 15 Sep 2026 | Issues with closing tickets | 10:42-11:28 |
| 14 Sep 2026 | Notifications not playing sound in the browser | 18:37-19:58 |
| 8 Sep 2026 | Help Center creation not working for new Gorgias accounts | 15:36-16:12 |
| 2 Sep 2026 | Instagram direct message delayed ingestion | 14:49-19:11 |
| 1 Sep 2026 | Cloud service provider network incident may affect a subset of Gorgias Customers | 15:19-18:59 |
| 1 Sep 2026 | Voice/SMS functionality degraded due to a Twilio incident | 17:05-18:00 |
| 27 Aug 2026 | Ticket, order and product search showing outdated results | 16:22-17:02 |
| 11 Aug 2026 | CORS issues on signup | 11:36-13:16 |
Two patterns in that list are worth internalising.
The single "critical" in 180 days was chat. On 22 June 2026, "Chat are not working properly" is the only incident Gorgias rated critical in the whole window. If chat is your primary channel, that is your risk profile in one line — and a widget that will not load is more often a local problem than a Gorgias one.
Third-party failures show up under Gorgias's name. 1 September produced two separate incidents on the same day — a cloud provider network incident and Twilio degrading voice and SMS. Neither was Gorgias's code. This is exactly why the Integrations and Infrastructure groups exist, and why "Gorgias is down" is usually the wrong sentence.
The one worth reading in full: the WhatsApp replay
On 11-12 August 2026, Gorgias posted an incident titled "WhatsApp: Unexpected Ticket Activity". Its resolution note is unusually candid, and worth quoting because it describes a failure mode that costs money:
"A replay of WhatsApp webhooks caused older messages to be imported, which resulted in closed tickets reopening and, in some cases, duplicate tickets being created… Billable tickets created as a result of this incident have been removed from affected merchants' billing counts… Merchants who were already charged before this correction was applied will receive a refund in the following days."
Two lessons. First, an incident can be over while its damage is still in your data — reopened tickets and duplicates do not clean themselves up, and your CSAT and first-response metrics for that window are wrong. Second, when an incident inflates a billable count, Gorgias has corrected it before; if it happens again, the incident note is your evidence.
Why does Gorgias look down when Shopify is the problem?
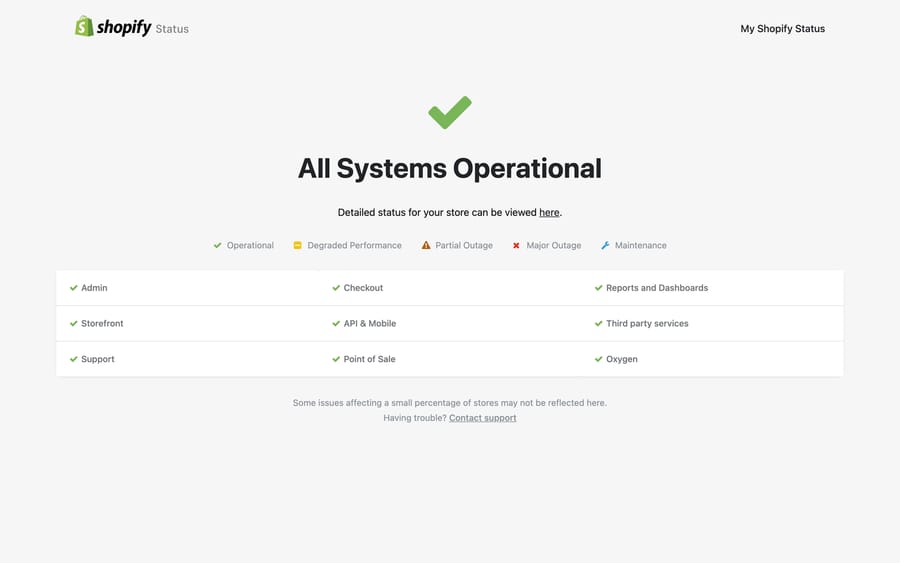
The single most common false alarm. Gorgias reads order and customer data from Shopify to fill the customer sidebar, look up orders and run refunds, so when Shopify has a problem, Gorgias looks broken while being entirely operational: an empty sidebar, order lookups failing, refund and cancel actions erroring.
Check Shopify separately at shopifystatus.com (status.shopify.com redirects there). The tell is scope: if tickets load and reply fine but order data is missing, look upstream. Our guide to Gorgias Shopify orders not syncing covers the non-outage causes of the same symptom, and Gorgias for Shopify explains how deep the dependency goes. The same logic applies to ReCharge, Stripe, Aircall and Yotpo — a red component under Integrations points at the partner.
Is it Gorgias, or is it you?
Work this ladder in order before telling anyone there is an outage.
1. Check the components you actually use. Not the banner. If Helpdesk and your channel are green, lean towards a local cause.
2. Check Shopify, and any other integration in the failing path. Order data broken but tickets fine is almost always upstream.
3. Test from another network and another device. Mobile data instead of office Wi-Fi. If it works on cellular, the fault is your network or firewall — corporate proxies and DNS filtering block help-desk assets more often than you would think.
4. Try an incognito window or a different browser. If incognito works, the cause is an extension, a stale session or a corrupted cache. Ad blockers and privacy extensions are the usual suspects with chat widgets and embedded apps.
5. Isolate the broken thing. One social inbox, one custom-domain Help Center, one integration — that is a component or a credential, not a platform outage. Emails not creating tickets and an integration that stopped working both look like outages and almost never are.
6. Only then, corroborate with a third-party tracker. Downdetector, IsDown and StatusGator aggregate user reports and mirror Gorgias's components. A spike there plus a red component on the official page is confirmation. A spike on its own is not — those sites are crowd-sourced, and a handful of reports from one company's office network looks identical to an outage.
The rule: everything broken plus a red component = Gorgias. One thing broken plus all green = you, an integration, or Shopify.
How do you get notified about Gorgias outages?
Refreshing a status page during an incident is wasted time. Gorgias's Statuspage offers email, SMS, Slack, webhook and Atom/RSS subscriptions, and posts to @gorgiasops on X. A Slack subscription into your support channel is the highest-signal option for a team, because it puts the incident where the people who need it already are.
Subscribe to Shopify's status page too. Your help desk is only as available as the store data behind it.
What should you do during a real Gorgias outage?
Subscribe to the specific incident so you get the progress updates through to "resolved".
Tell customers before they tell you. A banner on the store or Help Center and an away message on chat. "We're having a temporary issue with our support system" beats silence, especially during a drop or a sale.
Switch channels rather than switching off. If one channel is down and others are up, say so and route people to a working one. Your macro library is what keeps replies consistent while everyone is improvising.
Leave your configuration alone. The instinct to fix an outage by toggling rules, reinstalling the Shopify app or rewriting routing reliably creates a second problem to clean up afterwards. If the status page says it is Gorgias or Shopify, change nothing.
Capture work out of band. If tickets are not loading, log what comes in somewhere temporary and reconcile afterwards.
Verify before you announce the all-clear. When the incident is marked resolved, open a ticket, send a reply and load a customer's orders yourself. And after an incident like the WhatsApp replay, audit for reopened or duplicated tickets — Gorgias's ticket statuses are worth understanding before you try to clean that up, because "closed" and "resolved" behave differently from what most teams assume.
Does an AI agent on top of Gorgias keep working during an outage?
If you run an AI agent on top of Gorgias, it inherits Gorgias's availability. An agent layer reads and writes through the help desk's platform, so when the platform is down the layer is down with it — no automation survives its own substrate. What it changes is the normal day: fewer repetitive tickets in the queue means less backlog to dig out of when service returns.
For the record, because an earlier version of this page said otherwise: Macha does work with Gorgias. It runs on Zendesk, Freshdesk, Gorgias, Front, HubSpot or Intercom. It is an AI agent layer on top of the help desk you already run — it does not replace Gorgias and it will not keep answering when Gorgias is offline. It is priced on monthly ticket volume from $299 a month for 750 tickets, about $0.40 a ticket, with setup and monitoring by the Macha team included, and the trial is $50 of free usage with no credit card.
How do you prepare for the next Gorgias outage?
- Bookmark status.gorgias.com and make checking it the team's first reflex.
- Subscribe on Slack, for Gorgias and for Shopify.
- Write a one-page runbook: who posts the customer banner, where tickets get logged, which fallback channel you use, who calls the all-clear.
- Ask Gorgias support which cluster you are on, and write it down.
- Know your dependency chain. Anything sitting on top of Gorgias depends on Gorgias; Gorgias's order features depend on Shopify. Knowing that in advance tells you instantly what will and will not work. What Gorgias is has the fuller picture.
How we researched this
We read status.gorgias.com, its incident history and its uptime view in a browser on 21 September 2026, and pulled the component list and incident feed from the same site's public Statuspage API so the counts are exact rather than eyeballed. Every component name, incident title and UTC window in this post comes from that data; the WhatsApp incident is quoted from Gorgias's own resolution note. The incident feed returned its 50 most recent entries, reaching back to 9 March 2026, so the 180-day window quoted here is complete. We re-pulled the same API on 24 September 2026: still 77 components in the same seven groups, All Systems Operational, and no new incidents since 16 September. We do not have a Gorgias account, so nothing was reproduced in-app, and Gorgias does not publish which cluster an account runs on — hence the advice to ask support rather than guess.
Frequently asked questions
Is Gorgias down right now? Check status.gorgias.com and read the specific component you rely on rather than the banner. Gorgias publishes 77 components in seven groups, so an incident can hit WhatsApp, one cluster or the Shopify integration while the help desk itself is operational. When we checked on 21 September 2026 the page read All Systems Operational.
What is the Gorgias status page URL? status.gorgias.com. It runs on Atlassian Statuspage and carries the current component states, an incident feed, scheduled maintenance, a 90-day uptime view, a full incident history at status.gorgias.com/history, and two live metrics — average background task duration and average REST API latency.
How often does Gorgias have outages? Its own incident feed listed 46 incidents in the 180 days to 21 September 2026, 24 of them in the last 90 days: 1 critical, 30 major, 11 minor and 4 informational. The median incident lasted 74 minutes and 30 of the 46 were resolved within two hours. The longest ran about 51 hours in mid-July 2026.
Why does the Gorgias status page show 100% uptime when there were incidents? Because Statuspage calculates uptime per component and rounds it, and most Gorgias incidents affect one sub-component for well under two hours. Use the uptime bars for long-term trend and the incident history for what has actually been going wrong.
Gorgias is loading but order data and the customer sidebar are blank — is Gorgias down? Usually not. Gorgias pulls order and customer data from Shopify, so a Shopify problem empties the sidebar and breaks order actions while Gorgias itself is fine. Check shopifystatus.com separately, and look at the Shopify integration components under Helpdesk Integrations on Gorgias's page.
How do I get notified about Gorgias outages? Subscribe on status.gorgias.com by email, SMS, Slack, webhook or Atom/RSS, or follow @gorgiasops on X. A Slack subscription into your support channel is usually the best option for a team, and it is worth subscribing to Shopify's status page at the same time.
What is the difference between "degraded performance" and "major outage"? Atlassian Statuspage uses five states: operational, degraded performance (slow or flaky but mostly working), partial outage (down for some users or regions), major outage (fully unavailable) and maintenance (a planned window). Degraded is not down, and partial means the problem is scoped rather than global.
The Gorgias status page is all green but it is broken for me — what now? Work down the list: check the exact components you use rather than the banner, check Shopify, test from a different network and device, open an incognito window or another browser to rule out extensions and cache, and see whether only one channel or integration is failing. A single broken thing with everything green is a local or partner problem.
Which Gorgias cluster am I on? Gorgias runs eleven named clusters, and we could not find yours exposed anywhere in the app. Incident titles name the affected cluster, so knowing yours turns a vague incident into a yes or no. Ask Gorgias support and record it in your runbook before you need it.
Can I trust Downdetector for Gorgias? Only as corroboration. Downdetector, IsDown and StatusGator aggregate user reports and mirror Gorgias's components, which is useful for spotting something widespread quickly, but they are crowd-sourced — a cluster of reports from one company's office network looks the same as an outage. Confirm against status.gorgias.com.
Sources:
- Gorgias Status — component states, uptime and live metrics, read 21 Sep 2026
- Gorgias incident history — incident titles, severities and UTC windows
- Shopify Status — status.shopify.com redirects here
- Gorgias Helpdesk Documentation
Add AI agents to your Gorgias
Macha reads the ticket, drafts the reply and takes the action, inside the Gorgias you already run.