


 Shopify
 Stripe
 Slack
Slack Notion
 Google Workspace
 Confluence
How to Measure Your AI Agents' Performance with Agent Analytics


Once your agents are running autonomously, the obvious question is: are they actually working? How many tickets are they handling, which agents are busiest, what's triggering them, and is anything misbehaving? Agent Analytics answers all of that. It's the reporting layer for your automation — every run your agents make, in one place, filterable and reviewable.

If you've used AI agents that felt like a black box, this is the opposite: full visibility into what they're doing.
What Agent Analytics shows you
Open Agent Analytics (under the Analyze section) and you get a log of every conversation your agents have had — interactive chats, chatbot sessions, and autonomous trigger runs alike. Each row tells you the essentials at a glance.
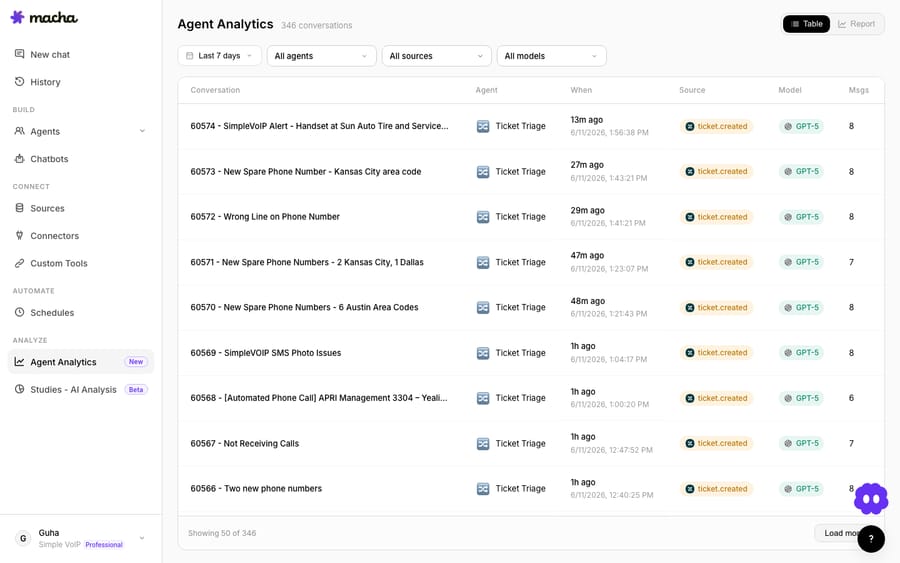
The columns:
- Conversation — the title/subject of the run (e.g., the ticket it handled).
- Agent — which of your agents did the work.
- When — the timestamp, so you can see activity over time.
- Source — what triggered the run (e.g.,
ticket.created), so you know it fired from the right event. - Model — which AI model ran (which is also your cost driver).
- Msgs — how many messages the run took — a quick proxy for how much work each one required.
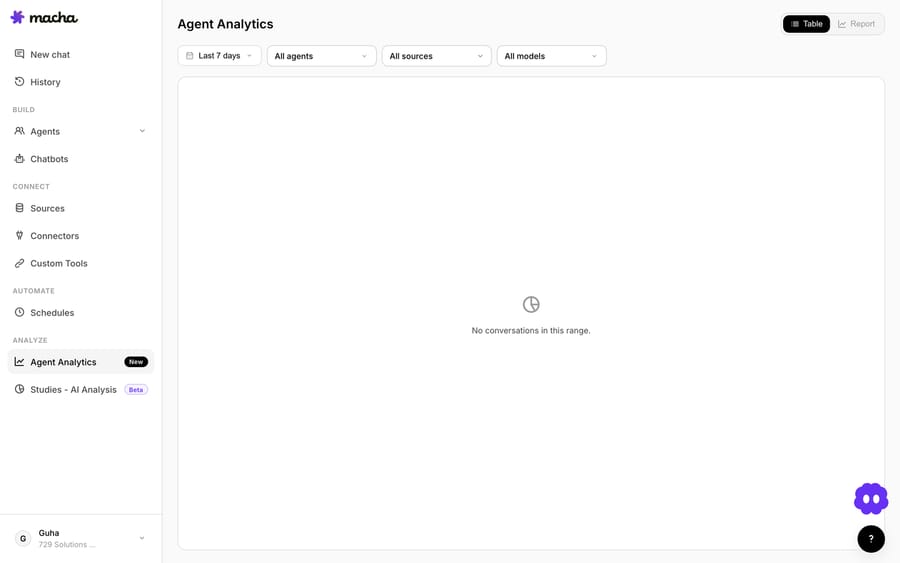
At the top, the total count (e.g., "346 conversations") and filters for date range, agent, source, and model let you slice it however you need.
Table view vs. Report view
There are two ways to look at the same data:
- Table — the run-by-run log above. Use it to investigate specific runs, spot-check quality, and see exactly what happened.
- Report — the aggregated view. Use it for the big picture: volume over time and how it breaks down across agents, sources, and models.
You'll live in Table when something looks off and Report when you want the trend.
What to actually look for
The data is only useful if you know what questions to ask of it:
- Volume & trend. Is automation handling more over time? A rising run count on your support agents is the headline "it's working" signal.
- Busiest agents. Which agents carry the load? If one agent does 80% of the runs, that's where to focus tuning.
- Source breakdown. Are runs firing from the triggers you expect (
ticket.created, a schedule, a webhook)? An agent firing from the wrong source — or far more often than it should — is a misconfiguration to catch. - Message counts. A run that takes a normal number of messages is healthy. A run with an unusually high message count can mean the agent is struggling — or looping on a ticket. (If you see runaway message counts, see how to stop an agent from infinitely looping.)
- Model usage. Which models are running, and where? If an expensive model is doing simple work, switch that agent to a cheaper one and cut cost with no quality loss.
A simple weekly review
A five-minute habit that keeps automation healthy:
- Filter to the last 7 days.
- Check total volume vs. the prior week — up is good.
- Scan for abnormal message counts (possible loops or confusion).
- Confirm runs are firing from the expected sources.
- Spot-check a few Table rows to eyeball answer quality.
Anything odd points you straight at the agent to fix.
Reading the numbers: healthy vs. warning signs
A quick reference for what the log is telling you:
| What you see | Likely meaning | What to do |
|---|---|---|
| Steady or rising run volume | Automation is taking load off the team | Keep going; widen scope |
| One agent doing almost everything | Your workhorse — or others aren't triggering | Check the quiet agents are firing |
| A run with an unusually high message count | The agent is struggling or looping | Tighten instructions; add a loop guard |
| Runs firing from an unexpected source | Wrong or extra trigger wired up | Fix the trigger on that agent |
| A premium model on simple runs | Overpaying for easy work | Switch that agent to a cheaper model |
| A sudden spike on one topic | A release, outage, or pricing change hit | Investigate; maybe a temporary agent |
None of this needs a data team — it's all visible from a glance at the log and the filters.
Best practices
- Review weekly. Trends and problems show up early when you look regularly.
- Watch message counts as your loop/early-warning signal.
- Right-size models using the Model column — don't pay for a premium model on simple runs.
- Tie it back to outcomes. Pair the volume here with your helpdesk's CSAT and resolution metrics for the full picture.
Frequently asked questions
What is Agent Analytics? A reporting view that logs every run your Macha agents make — chat, chatbot, and autonomous — with the agent, trigger source, model, and message count, filterable by date, agent, source, and model.
Does it cover autonomous runs, not just chats? Yes — every conversation, including trigger-fired autonomous runs, appears in the log.
How do I tell if an agent is misbehaving? Watch for abnormally high message counts (a sign of looping or struggle) and runs firing from unexpected sources or far more often than expected.
Can I see costs here? The Model column shows which model each run used, which is your main cost driver; right-size models where an expensive one is doing simple work.
Where is it? Under the Analyze section in the left nav.
The bottom line
Automation you can't see is automation you can't trust. Agent Analytics gives you the run-by-run truth — who did what, triggered by what, with which model, and how much work it took — plus an aggregated view for trends. Make a five-minute weekly review a habit, watch your volume rise and your message counts stay sane, and you'll always know your agents are pulling their weight.
See what your agents are doing: open Agent Analytics and review your last 7 days. 7-day free trial, no credit card required. Start free.
Resolve tickets automatically with AI agents
Macha's AI agents work on top of the help desk you already use — no code.


