





 Shopify
 Stripe
 Slack
Slack Notion
 Google Workspace
 Confluence

How Do You Extract Structured Data From Support Tickets? Designing a Study Schema


A Macha Study reads every ticket in a batch and fills in a grid, one row per ticket and one column per question you asked. Whether that grid is clean depends less on the model than on the schema: the typed columns you define and the guidance you write for each.
Key takeaways
- Extracting structured data from support tickets in a Macha Study starts with a schema of typed columns, one line of guidance per column, and a test run before the full batch.
- A Macha Study schema offers six column types: Yes/No, Single choice, Multiple choice, Number, Short text and Long text, and the type decides how answers aggregate.
- Yes/No, Single choice and Multiple choice columns render in the Study Report as bar charts, while Number columns render as a histogram with min, mean, median and max.
- A Study Test run samples 10 to 50 records so you can check types and guidance, and only successfully processed records are charged.
- A single Study run processes up to 20,000 records, and the Review step shows the matching record count and estimated cost before you confirm.

To extract structured data from support tickets, define a schema of typed columns (Yes/No, Single choice, Multiple choice, Number, Short text, Long text), write one line of guidance per column, test it on 10 to 50 tickets, then run it across the batch. In a Macha Study that schema lives in the Extract step, and the column type decides whether each answer becomes a chart or text you read by hand.
| Step | What you decide | Where in a Study |
|---|---|---|
| 1. Scope | Which tickets, by Zendesk search query and date range, and which fields the model sees | Source and Scope |
| 2. Schema | One typed column per question, each with guidance | Extract |
| 3. Test | A sample of 10 to 50 records to check types and guidance | Test run |
| 4. Run | Confirm record count and estimated cost, then run (up to 20,000 records per run) | Review |
The wider LLM-extraction community keeps arriving at the same lesson. Simon Willison, writing about structured data extraction with LLM schemas, frames the whole job as "you design the shape you want, then teach the model to fill it." LandingAI's extraction-schema guide puts it more bluntly: "the field names and descriptions you write guide the extraction engine, and specific, detailed definitions lead to accurate extraction." A 2025 arXiv paper, PARSE, even shows that optimizing the schema itself measurably improves extraction reliability — the schema is a first-class input, not an afterthought.
The practical version of that, inside Studies, comes down to three things: how to choose the right typed column for each question, how to write per-column guidance that actually changes the model's answer, and how those two choices determine whether your finished Study produces a chart you can act on or a pile of free text you have to re-read by hand.
Studies, including the schema editor described here, is part of Macha's single plan, which includes every feature (see pricing).
What are the ways to extract structured data from support tickets?
If you've searched for how to extract structured data from support tickets, you've probably hit the engineering path first: pull tickets through the Zendesk or Freshdesk API, define a JSON Schema or a Pydantic model, and call an LLM with a structured-output / function-calling mode so it returns validated fields. That route is powerful and exactly what Simon Willison and the PARSE paper are describing — but it assumes you'll write code, host the script, manage API keys and rate limits, and rebuild the whole thing into charts yourself. For a one-off "what are these 2,000 tickets actually about?" question, that's a lot of scaffolding.
A Macha Study is the no-code version of that same loop. You define the shape you want in a visual schema editor (the equivalent of your Pydantic fields), Studies handles the batching, retries, validation, and per-record cost, and the typed output renders straight into charts and a CSV — no script to maintain. The schema-design principles are identical to the code approach; you just express them in a form instead of a class. If your team eventually needs this live on every new ticket, you graduate from a Study to a triage agent (covered at the end). The schema-design rules below apply whichever path you'd otherwise take.
Where does the schema live in a Study?
A Study builder walks four steps — Source → Scope → Extract → Review. Source and Scope decide which records the AI reads (Zendesk tickets, narrowed by a search query, a date range, and which ticket fields the model is allowed to see). The schema you're designing lives in Extract, and it's the only step where you're really making decisions about what you want to know.
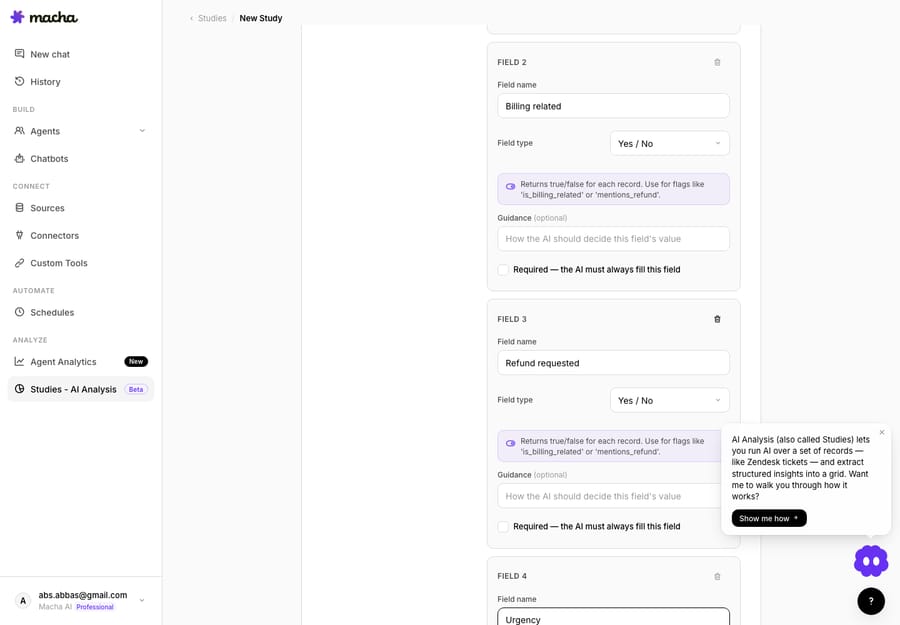
Each column you add becomes a question the model answers independently for every record. The two settings that matter on each column are the Answer type (what shape the answer takes) and the guidance (how the model should decide). Get those right and everything downstream — the grid, the Report charts, the CSV, the knowledge push — just works.
Which column type should each question use?
Studies gives you six column types. The trap is choosing by the question's wording; the right move is choosing by the shape of the answer you'll want to aggregate later.
| Answer type | Use it when the answer is… | Renders in the Report as… |
|---|---|---|
| Yes / No (boolean) | a true/false flag — is this billing-related? | bar chart (2 buckets, count + %) |
| Single choice | exactly one value from a fixed list — primary category | bar chart (one bar per option) |
| Multiple choice | any number of values from a fixed list — all products mentioned | bar chart (per-option counts) |
| Number | a count or score — urgency 1–5 | histogram (min / mean / median / max) |
| Short text | a tight free-form value — order ID, a 6-word summary | not charted (read/sort/export) |
| Long text | a paragraph — a full reason narrative | not charted (read/sort/export) |
The thing to internalise: typed columns are what make the output aggregatable. A Yes/No becomes a clean two-bar chart. A single-choice column becomes a ranked distribution. A Number becomes a histogram with summary stats. The two text types are deliberately not charted — they're for values you'll read or export, not count.
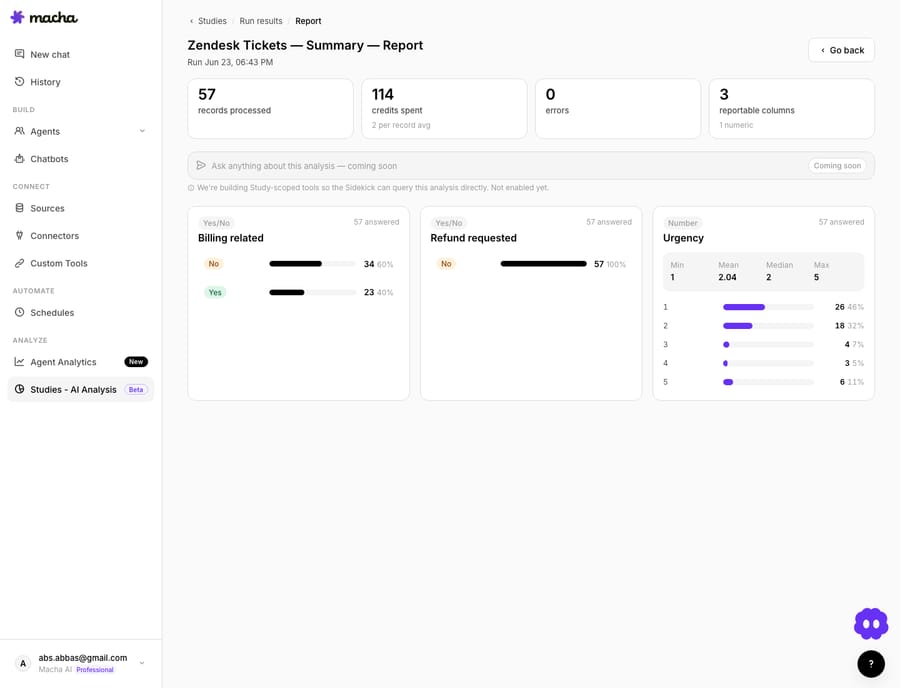
This is exactly the principle the extraction literature converges on: keep schemas small and purposeful, and make each field drive a decision, a join, or a stored artifact. If a column won't change a staffing call, a routing rule, or something you'll store, it probably doesn't belong in the schema.
Yes/No vs. Single choice — the most common mix-up
Reach for Yes/No when the question is genuinely binary and you only care about the split. Is this a billing ticket? Yes/No. Reach for Single choice the moment there are three or more mutually exclusive buckets you'd want ranked — category: shipping, returns, technical, billing, other. The tell is the chart you want to see at the end: two bars → Yes/No; a ranked bar distribution → Single choice.
When you set up a choice column, options are entered as tag-style pills — type each value and hit Enter, or paste a comma-separated list and Studies splits it into pills for you. Click the × on a pill to drop a value.
Single vs. Multiple choice
Single choice forces exactly one answer — best for a primary category, where letting the model pick two would muddy the distribution. Multiple choice lets the model select any number of the options — right for "which of our products does this ticket touch?" where a ticket can legitimately mention three. The cost is that multiple-choice percentages don't sum to 100% (each option is counted independently), so read those bars as "share of tickets that mention X," not "share of total."
Number — for anything you'll want a mean or a tail on
Use Number whenever you want statistics rather than buckets: an urgency score, a count of times the customer wrote in, a sentiment rating. The Report gives you min / mean / median / max and a histogram — and Studies bins it intelligently: with ≤10 unique values each value gets its own bar; above that it auto-bins into roughly ten equal-width ranges. A number column is how you surface a tail — the small slice of 5-out-of-5-urgency tickets you'd want routed fast that an average alone would hide.
Short vs. Long text — use sparingly
Text columns are powerful but they don't aggregate, so every text column is a column someone has to read. Use Short text for tight, structured values (an order ID, a 5–8 word summary you can scan down a column). Use Long text only when you genuinely need a narrative — a full "reason for contact" you'll later push into a knowledge source. A schema that's all Long text is just a re-written ticket archive; a schema that's mostly typed columns plus one short summary is a dataset.
How do you write per-column guidance that changes the answer?
The Answer type sets the shape. The guidance sets the decision rule — and it's the single highest-leverage thing you can write. Each column takes an optional guidance note, and there's an overall instructions box for tone and cross-cutting edge cases. Treat guidance as a tiny spec for that one question.
A few rules that hold up in practice (and match what the extraction-tooling guides recommend):
- Define the column, don't just name it. "Billing related" is a header; the guidance is where you say "Yes if the ticket mentions a charge, invoice, refund, subscription, or payment method — including disputes about an amount. No for shipping, product, or how-to questions." LandingAI's whole thesis is that the description, not the field name, drives accuracy.
- Enumerate the edge cases you already know. If "urgency 5" should be reserved for outages and chargeback threats, say so. If a ticket can mention billing and be primarily about shipping, tell the model which wins for a single-choice category.
- Anchor your number scales. A 1–5 urgency column without a rubric gives you the model's private idea of urgency. Spell out what 1 means and what 5 means; the median you get back is only as trustworthy as that anchor.
- Mirror your option labels exactly. For choice columns, write guidance using the same words as your pills. Don't define a "Refund/return" bucket and then describe it as "money-back requests" — keep the vocabulary identical so the model maps cleanly.
- Say what "unknown" looks like. Tell the model what to do when the ticket genuinely doesn't say — pick an "Unknown/other" option or leave a short text blank — rather than letting it guess.
A short info chip under the Answer-type selector reminds you what each type returns while you're choosing — a small nudge toward picking the right shape before you write the guidance.
How do you test a schema before the full run?
A schema is a hypothesis, and the extraction researchers are unanimous on one point: schemas improve under real data pressure, not in planning docs. Studies builds the feedback loop in. Before you commit to the full batch, run a Test run that samples 10–50 records (there is also a quick "Test on 3"), reads the answers, and tells you fast whether your types and guidance are landing.
What to look for in a test:
- A Yes/No column that's coming back almost all Yes (or all No) usually means the guidance is too loose — tighten the rule.
- A single-choice column with a fat "Other" bar means you're missing an option, or two of your options overlap.
- A Number column whose values cluster on one value means your scale isn't anchored — add a rubric.
- Free text that reads like the model is hedging ("possibly billing-related?") means push the decision into a typed column instead.
Test runs are marked as previews in the UI so they never clutter your real history. Per the Studies docs, only successfully processed records are charged: errored records and records a cancelled run never reached cost nothing, so iterating on a 25-record sample is cheap. Tune, re-test, then scale.

What does a Study cost to run?
When the schema holds up on a sample, the Review step shows the exact matching record count, the cost per record (the badge sits right next to the model selector), and the total estimate, calculated from the exact query the run will use. Clicking Run study brings up an explicit confirmation modal with the record count, estimated cost, and model — you confirm once before any work starts, and nothing is charged until you do.

Schema design is worth one pass before you run, though the reason is quality and speed rather than price: more columns and more reasoning-heavy text columns push toward a stronger, slower model; a lean schema of typed columns runs fine, and faster, on a lighter one. A single run is capped at 20,000 records; for more, split the work into runs by date range. The Review step shows what a given run will cost before you confirm, and the pricing page has current plans.
What else can a well-designed schema do after the run?
Once a run finishes, a good schema keeps earning. Because the columns are typed, the Report aggregates them into charts you can drill into. Because you wrote tight guidance, those charts are trustworthy enough to make a call on. And because the structure is clean, you can push the run to a Knowledge Source — each row becomes an indexed document (your selected fields merged into a single article body per record) that your live agents on Zendesk can then search on real tickets. A schema you designed carefully to answer one question becomes durable, searchable context. Sloppy free-text columns don't survive that trip; typed, well-defined ones do.
When is a Study schema the wrong tool?
A few honest limits so you design with eyes open:
- A schema is not a substitute for tagging strategy. Studies tells you what your tickets are; if your team needs those labels live on every new ticket, that's a triage agent with a trigger, not a one-off Study. Use a Study to discover the categories; use an agent to apply them going forward.
- Over-wide schemas cost more and dilute focus. The extraction guidance is consistent here — models do best on a focused set of related fields. Ten loosely-related columns on one run is usually two cleaner Studies waiting to happen.
- Guidance can over-fit your sample. If you tune purely against 25 test records, you can bake in quirks of that window. Sanity-check on a second sample from a different date range before a large run.
- Text columns don't aggregate. If you find yourself adding a fourth Long-text column, ask whether each one could be a typed column instead — otherwise you've built a slower way to re-read tickets.
FAQ
What column types can a Study schema use? Six: Yes/No (boolean), Single choice, Multiple choice, Number, Short text, and Long text. Each column also takes optional per-column guidance, and there's an overall instructions box for tone and shared edge cases.
Which types show up as charts in the Report? Yes/No, Single choice, and Multiple choice render as bar charts with counts and percentages; Number renders as a histogram with min/mean/median/max. Short and Long text aren't charted — they're for reading, sorting, and export.
How do I add options to a choice column? Type each option and press Enter to add it as a pill, or paste a comma-separated list and Studies splits it for you. Remove a value with the × on its pill.
How do I know my schema is good before a full run? Run a Test run on 10–50 records, read the answers, and adjust types and guidance. Test runs are flagged so they don't pollute your history, and you only pay for records that successfully process.
Does the schema affect cost? Indirectly. Cost is charged per successfully processed record, so the number of matching records matters most, and more columns or heavier text reasoning push you toward a stronger, slower model. The Review step shows the estimated total before you confirm. See the pricing page.
Which plans include Studies? Macha sells one plan, priced by monthly ticket volume from $299 for 750 tickets, and every feature is included, Studies and its Report view among them. See pricing for current tiers.
How many records can one Study run process? Up to 20,000 records per run. To analyse more, split the work into several runs with date-range filters.
How do you design your first Study schema?
The fastest way to learn schema design is to build one and read a test run. Start a free trial ($50 of usage, no credit card, no time limit), connect Zendesk, define four columns — a couple of Yes/No flags, one choice category, one number — write a sentence of guidance on each, and test it on 25 tickets. The Studies docs have the full walkthrough, and the companion piece on running a Study end to end shows a real 57-ticket run start to finish.
Written by Abbas (Customer Support & AI, Macha) · Reviewed by Ankeet Guha (Co-founder & CTO) · Published 2026-06-24 · Last updated 2026-09-24.