





 Shopify
 Stripe
 Slack
Slack Notion
 Google Workspace
 Confluence

How Does Gorgias Reporting Work? Analytics, CSAT and Revenue Stats Explained (2026)


Gorgias puts its reporting in Analytics, where pre-built Support Performance reports cover CSAT, response times, agents and channels, and custom dashboards hold up to 20 charts each. Below is what each report measures, which views need a plan or a Shopify store, and where native reporting stops.
Key takeaways
- Gorgias reporting lives in Analytics, opened from the dropdown menu in the top-left corner, with pre-built Support Performance reports and custom dashboards.
- Gorgias allows up to 10 custom dashboards, each holding up to 20 charts, exportable to CSV; only Admins and Leads can create, edit or delete them, and every role can view them.
- The Gorgias Revenue report needs a connected Shopify store on a Pro, Advanced or Enterprise plan, and counts a ticket as converted when the customer buys within three days.
- The Gorgias Agents report shows each agent's closed tickets, CSAT, first response time, resolution time, one-touch tickets and online time, and adds a Top performers panel at three or more agents.
- Gorgias AI Agent is billed per automated interaction, with Pro including 190 interactions for $190 a month and extra interactions at $1.50 each.

Gorgias reporting lives in Analytics, opened from the dropdown menu in the top-left corner of the helpdesk: pre-built Support Performance reports (Overview, Productivity, Agents, Busiest times of day, Channel, Satisfaction, Help Center, Revenue) plus custom dashboards, up to 10 of them with up to 20 charts each. Most reports run on every Helpdesk plan; Revenue needs a connected Shopify store on Pro, Advanced or Enterprise.
| Report | Key metrics | Notable gate |
|---|---|---|
| Overview | CSAT, FRT, resolution time, messages/ticket, ticket volume | All Helpdesk plans |
| Productivity | Tickets replied, messages sent, handle time, one-touch | All Helpdesk plans |
| Agents | Per-agent CSAT, FRT, resolution, closed %, online time | All Helpdesk plans; only Admins and Leads download data |
| Satisfaction | CSAT scores, response rate, per-ticket ratings + comments | Requires CSAT surveys enabled |
| Channel / Busiest times | Tickets by channel and by hour (heatmap) | All Helpdesk plans |
| Revenue | Support-attributed sales per agent/ticket | Shopify store + Pro, Advanced or Enterprise |
| Dashboards | Up to 10 dashboards × 20 charts, CSV export | Admins/Leads edit; all view |
Where do you find reports in Gorgias?
Click the dropdown menu in the top-left corner of the helpdesk and select Analytics (older Gorgias docs and screenshots still call this area Statistics). From there the tooling splits into two things that are easy to confuse.
Reports are the pre-built views Gorgias maintains for you: curated collections of charts grouped under Support Performance: Overview, Productivity, Agents, Busiest times of day, Channel, Satisfaction, and Help Center, and they now include AI Agent's performance alongside your human team. You don't build these; you filter them. Per the Statistics and Reporting docs, every report can be sliced by date range, agent, channel, integration, and tag, so "CSAT this month for the email channel" or "resolution time for the returns team" is a couple of clicks.
Dashboards are the custom layer. A dashboard is a workspace where you pull individual charts out of the reports and arrange them into one personalized view. According to Gorgias' Statistics Dashboards documentation, you can create up to 10 dashboards, each holding up to 20 charts, and export any of it to CSV. Dashboards are shared across the organization and every role can view them, but only Admins and Leads can create, edit, or delete them; other roles can view.
What does the Overview report measure?
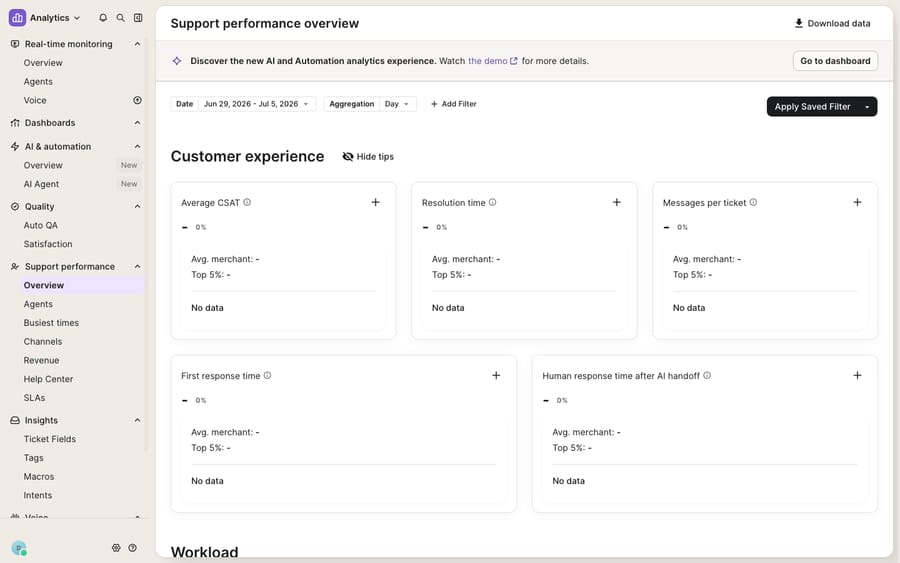
The Overview is the report most teams live in. It's divided into two halves.
The Customer experience cards cover the metrics your customers actually feel:
- Average CSAT — the satisfaction score from post-resolution surveys.
- First response time (FRT) — how long a customer waits before the first agent reply.
- Resolution time — how long from creation to a closed ticket.
- Messages per ticket — a proxy for back-and-forth; a high number on WISMO tickets usually means agents are hunting for order data.
The Workload cards cover volume: created, open, and closed tickets, plus a breakdown of open and closed tickets by channel so you can see whether email, chat, or social is eating the queue.
If you're brand new to the platform and want the wider picture of how tickets, rules, and channels fit together before diving into metrics, our what is Gorgias overview is the place to start.
How do the Productivity and Agents reports measure the team?
Two reports go deeper on your people.
Productivity aggregates the team's output: tickets replied to, messages sent, ticket handle time, and one-touch tickets (resolved in a single reply — a genuinely useful efficiency signal in ecommerce, where a clean "here's your tracking link" one-and-done is the ideal).
Agents is the per-person breakdown, viewable as a table or a heatmap. Per the Agent performance docs, each agent row shows closed tickets, percentage of closed tickets, customer satisfaction, tickets replied, messages sent, first response time, resolution time, one-touch tickets, and online time. A Top performers panel appears once you have three or more agents, and only Admins and Leads can download the data. Gorgias surfaces top performers and CSAT first, so a manager can spot both the workhorses and anyone whose satisfaction is slipping.
What do the Satisfaction and Channel reports show?
The Satisfaction report is where CSAT survey data lands. Gorgias sends a survey after a ticket is resolved, and the report shows response rate, average scores over time, and a row-by-row list tying each rating to the customer, the agent, the ticket, and any comment the customer left — per the CSAT reporting docs. That last part matters: a 2-star rating with a comment like "took three days to send my refund" is a coaching signal you can act on, not just a number.
The Channel report breaks tickets down per channel and per day, so a store seeing a spike in Instagram DMs during a product launch can staff for it. And Busiest times of day renders a heatmap of created, replied, closed, and message volume so you can line up shifts with demand.
Which plans get revenue statistics?
Here's the report ecommerce leaders ask about most, and the one with the clearest gate. Gorgias' Revenue statistics measure how much money your support team generates by helping customers through the purchasing journey. A ticket counts as converted when the customer buys within three days of creating it, using the same email address as the ticket; fully refunded orders drop out of the report.
The catch, per Gorgias' Revenue statistics documentation, is that the Revenue report is available on Pro, Advanced and Enterprise plans, and only when you connect a Shopify store (all roles can view it). If you're on Starter or Basic, or not on Shopify, the rest of Analytics still works, but the revenue attribution view stays dark. It's worth checking your tier against our Gorgias pricing explained breakdown before you build a dashboard around a metric you can't see yet.
What can't Gorgias reporting do?
Gorgias' Statistics suite is legitimately strong. It's native, it's filterable, and for an ecommerce team it covers CSAT, agent productivity, channel mix, and — on Shopify Pro — revenue attribution without a single export. Credit where it's due: most teams will never outgrow the built-in reports.
But it's worth being clear about what reporting is and isn't. Statistics measures what already happened; it doesn't change the numbers. The Overview will faithfully tell you your first response time is climbing during a sale — it won't draft the reply that pulls it back down. It shows a stack of one-touch tickets you didn't achieve; it can't fetch the order status that would have made them one-touch. And the analytics are, by design, about data inside Gorgias: they report on your help desk, not your whole stack.
That's the seam where an agent layer earns its place, and it's worth understanding the category of AI agents for customer service before you reach for one. Macha is one such layer: it runs on top of the Gorgias you already use through a live native connector — it does not replace your help desk or its reporting. Connect Macha to Gorgias, and it reads and writes the same tickets your Statistics already count: drafting or posting grounded first replies so FRT drops, resolving routine WISMO and return questions in one touch, and looking up live order or subscription status through a custom tool that turns your store or 3PL API into something the agent can call. The moves show up as better numbers in the reports you're already watching.
One honest contrast worth naming on billing. Gorgias' own AI Agent is billed per automated interaction: each plan buys a bundle of AI Agent interactions (Pro includes 190 for $190 a month on monthly billing), and extra interactions cost $1.50 each. Macha bills per ticket (one conversation, charged once however many replies, lookups or tags it takes, from $299 a month for up to 750 tickets), so the bill tracks the volume you handle rather than an outcome definition you don't control. Neither is "right," but they're genuinely different, and the pricing page lays out the tiers. If you'd rather have the agent draft answers that agents review before sending, that also holds — it slots in behind your existing macros and rules rather than around them, and the Macha–Gorgias integration walks through the connection.
The clean division of labour: keep Gorgias' Statistics as the source of truth for what happened and how the team is doing, and layer an agent on top for the part the reports can't do — actually moving the metrics by answering faster and resolving more in one touch.
FAQ
Where do I find reports in Gorgias? Open the dropdown menu in the top-left corner of the helpdesk and select Analytics. From there you'll see the pre-built Support Performance reports (Overview, Productivity, Agents, Busiest times of day, Channel, Satisfaction, Help Center) and the Dashboards area where you build custom views.
What metrics does Gorgias track? CSAT, first response time, resolution time, messages per ticket, created/open/closed ticket volume, one-touch tickets, tickets replied, messages sent, handle time, and per-agent online time — each filterable by date, agent, channel, integration, and tag.
Are Gorgias revenue statistics available on every plan? No. The Revenue report is available on Pro, Advanced and Enterprise plans, and only with a connected Shopify store. It counts a ticket as converted when the customer buys within three days of creating it. The other reports run on all Helpdesk plans.
How many custom dashboards can I create? Up to 10 dashboards, each with up to 20 charts, and you can export any of them to CSV. Dashboards are shared org-wide, but only Admins and Leads can create, edit, or delete them.
Can I improve these metrics without replacing Gorgias? Yes. An AI agent layer like Macha connects to Gorgias as a live native connector and runs on top of your existing help desk and its reporting — it doesn't replace them. It helps move the numbers by drafting or sending grounded first replies and resolving routine ecommerce tickets in one touch, while Gorgias stays the system of record for what happened.
Ready to turn your support metrics into ones your team is proud of? Start a free trial of Macha and connect it to your Gorgias in minutes.