 Zendesk
 Freshdesk
 Gorgias
 Front
Front Shopify
 Stripe
 Slack
Slack Notion
 Google Workspace
 Confluence
Is Zendesk Down? How to Check Zendesk's Status (and What to Do)


Your agents are staring at spinning tickets, the Web Widget won't load, or replies just aren't sending — and the first question is always the same: is Zendesk down, or is it just us? This guide gives you the fast answer, then shows you how to confirm it authoritatively (not by guessing from Twitter), how to tell a real Zendesk outage apart from a problem on your end, and exactly what to do while you wait for it to come back.

Quick answer: how to check if Zendesk is down
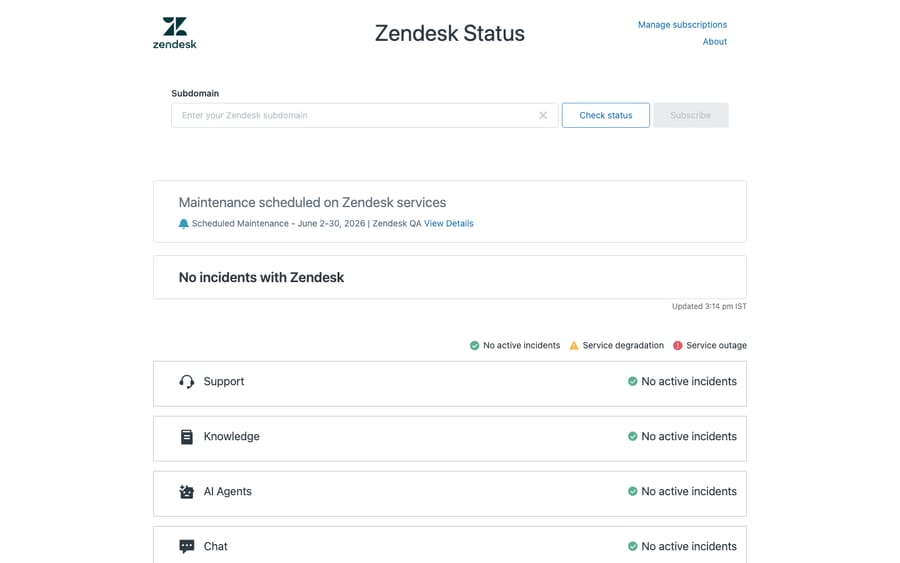
The single source of truth is Zendesk's own status page: status.zendesk.com. Don't rely on Downdetector, a tweet, or a colleague's hunch as your first move — go straight to the status page and enter your own subdomain, because Zendesk runs on isolated "pods" and an incident can hit some accounts while leaving others completely fine.
The 30-second version:
- Go to status.zendesk.com.
- Type your subdomain into the Check status field — for
mycompany.zendesk.com, entermycompany— and click Check. - Read the result for your instance: a Current active incidents box and a per-product status with a color legend (green = fine, yellow = degraded, red = outage).
- If it's green there but broken for you, the problem is probably on your side — jump to "Zendesk vs. your problem" below.
That's it. The rest of this guide is how to read that page properly and what to do next.
How to check Zendesk status authoritatively
Anyone can see the global status page, but the useful trick — the one most "is Zendesk down" articles skip — is checking your specific account, because that's the only check that accounts for pods.
Step 1 — Enter your subdomain (this is the important part)
On status.zendesk.com, there's a Check status field. Enter your subdomain (the part before .zendesk.com) and click Check. Per Zendesk's documentation, the page then shows the status for that subdomain — including a Current active incidents box that "displays all incidents currently impacting the subdomain." (That box is informational only; the items aren't clickable.)
Why this matters more than the generic page: Zendesk hosts accounts on pods (more on those below), and the subdomain entry resolves your view to the pod your account actually lives on. A global "all systems operational" banner can be true while your pod has an active incident — or vice versa.
Step 2 — Read the component statuses
Below the incidents box is a Services history list: the top-level Zendesk products, each with a visual 90-day history. You'll see products such as Support (ticketing), Knowledge (help center / Guide), AI Agents, Chat / Messaging, Talk (voice), and Explore (reporting). Expand a product to see its sub-components — for example, Zendesk notes that expanding Support reveals line items like Ticketing, Views, SLAs, each with its own history. That granularity tells you whether everything is down or just, say, voice or reporting.
This is genuinely useful for triage: if Talk is red but Support is green, your phone queue is the problem, not your tickets — and you can tell customers exactly that.
Step 3 — Know the legend
Zendesk uses three states, shown as colored bars. Straight from their docs:
| Indicator | Meaning |
|---|---|
| Green | No issues — the service is performing normally. |
| Yellow | Service degradation — intermittent or partial interruption. |
| Red | Service outage — the service is currently unavailable. |
So "yellow" doesn't mean down — it means slow, flaky, or partially broken (timeouts, delayed notifications, some requests failing). "Red" is the full outage. Hovering over a day in the history surfaces an incident summary with a description, when it was first reported, its resolution status, and a link to the detailed write-up.
Step 4 — Check for scheduled maintenance
Not every disruption is an "outage." Zendesk posts scheduled maintenance to the same status page ahead of time. If features are behaving oddly at an oddly specific time, check whether a maintenance window is posted before you escalate — planned maintenance is expected behavior, not a fault.
Step 5 — Subscribe so you're told next time
Rather than refreshing the page, subscribe. On the status page, after you Check your subdomain, click Subscribe, enter your email, click Request setup link, then confirm via the Set up status notification subscription email, choose which products to watch, and Confirm subscription. Zendesk supports email notifications (with SMS as an optional add-on), per the subscription docs. Now incidents come to you.
What's a "pod," and why does it change the answer?
A pod is a shared hosting environment — Zendesk describes it as "a high-rise office building with one Zendesk account occupying each floor," where the pod "provides the security, network, application, and database services shared by multiple Zendesk accounts." Your account is assigned to a pod (usually near where you signed up), sharing resources with other customers on it.
The line that matters during an outage: "service incidents affecting one Pod will not affect customers in other Pods." That's exactly why the generic status page can mislead you. An incident on Pod 17 is a full outage for accounts there and a non-event for everyone else. The only way to know which group you're in is to enter your subdomain (which resolves to your pod) — or find your pod number at the bottom of Admin Center Home, where Zendesk displays it.
Is it Zendesk, or is it you?
Half of "is Zendesk down" panics turn out to be local. Before you tell customers Zendesk is broken, run this elimination ladder in order — it goes from fastest to most thorough.
- Check the status page for your subdomain (above). Green across the board for your instance? Lean toward a problem on your end.
- Test from another network and device. Open your Zendesk on mobile data instead of office Wi-Fi, or from a phone instead of a laptop. If it works on cellular but not on the corporate network, the issue is your network/firewall, not Zendesk.
- Try an incognito/private window — or a different browser. If incognito works, a browser extension, a corrupted cache, or a stale session is the culprit, not the platform.
- Corroborate with third-party trackers. Sites like Downdetector, IsDown, or StatusGator aggregate user reports and mirror Zendesk's components. A spike there alongside a red component on the official page is strong confirmation of a real outage. Treat them as corroboration only — they're crowd-sourced, not authoritative. The official status page is the source of truth.
- Check your own integrations and DNS. If only one thing is broken — your Web Widget won't load, an app won't sync, SSO fails — the fault may live in that integration, a DNS/SSL issue on your domain, or a third-party service Zendesk depends on. A single broken feature with everything else green usually points here, not to a platform-wide outage.
The pattern to internalize: everything broken + red on your subdomain = Zendesk. One thing broken + all green = you (or an integration).
What to do during a real Zendesk outage
Status page confirms it — your pod has a red or yellow component. Now manage it. The goal is to protect the customer experience and your own sanity, not to "fix" something you can't fix.
- Subscribe to updates first. Get on the incident's notifications (above) so you're not refreshing a page. Zendesk posts progress and an ETA-ish cadence on the incident itself.
- Set customer expectations proactively. Post a banner on your help center or site, set an away message on your messaging channel, and tell customers you're aware and waiting on your provider. A short, honest "we're experiencing a temporary outage with our support system" beats silence.
- Don't thrash your settings. The instinct to "fix" it by toggling triggers, reinstalling apps, or changing routing during an outage usually creates a second mess to clean up once Zendesk recovers. If the status page says it's Zendesk, leave your configuration alone.
- Capture work out-of-band. If tickets aren't loading, log incoming issues somewhere temporary (a shared doc or spreadsheet) so nothing is lost, and reconcile once service returns.
- Have a fallback channel. Know in advance where customers go if Zendesk is unreachable — a status page of your own, a social account, or a simple email inbox. Decide this before you need it.
- Wait for "resolved," then verify. When the incident is marked resolved, do a quick end-to-end test (create a ticket, send a reply, load the widget) before announcing all-clear.
How to prevent the next scramble
You can't prevent Zendesk outages, but you can make them boring instead of chaotic.
- Subscribe to status notifications for the products you actually use — so you hear it from Zendesk before a customer tells you.
- Bookmark your subdomain-specific status check and make it the team's first reflex, ahead of guessing.
- Write a one-page outage runbook: who posts the customer banner, where you log tickets, which fallback channel you use, who owns the all-clear. Five minutes now saves an hour later.
- Know your pod (bottom of Admin Center Home) so you can read incident notes fast.
- Map your dependencies. Anything that sits on top of Zendesk — integrations, automations, AI agents, the Web Widget — depends on Zendesk being up. Knowing that chain ahead of time tells you instantly what will and won't work during an incident.
Where AI fits in during an outage
If you run an AI agent layer on top of Zendesk — like Macha, which works on top of your existing Zendesk ticketing system rather than replacing it — it's worth being honest about what that means during an outage. Macha is an AI agent layer that sits on top of Zendesk; it reads and resolves tickets through Zendesk's platform. So if Zendesk itself is down, the dependent layer is affected too — an AI agent can't read or update tickets that Zendesk can't serve. An AI layer makes your support faster on a normal day; it does not replace the helpdesk or keep it running when the platform is offline.
That's the honest framing. Where the AI layer helps is every other day: deflecting and resolving repetitive tickets so your queue is smaller and more manageable — which, incidentally, means less of a backlog to dig out of once an outage clears. Macha bills per AI action (each automated step it takes — drafting a reply, tagging, routing, resolving — not per closed ticket), so it scales with the work done, not with outage chaos. If that fits how your team works, you can try it free — 7-day free trial, no credit card required.
Frequently asked questions
Is Zendesk down right now? Check the authoritative source: go to status.zendesk.com, enter your subdomain in the Check status field, and click Check. Green bars mean Zendesk is operating normally for your instance; yellow means degraded service; red means an outage. Because Zendesk runs on isolated pods, always check your subdomain rather than assuming the global banner applies to you.
What is the Zendesk status page URL? status.zendesk.com. Enter your subdomain there to see the status for your specific account and pod, plus a 90-day history per product (Support, Knowledge, AI Agents, Chat, Talk, Explore, and more).
Why does Zendesk work for other companies but not for us? Most likely a pod difference or a problem on your end. Zendesk hosts accounts on separate pods, and "service incidents affecting one Pod will not affect customers in other Pods" — so an outage can hit your account and not theirs. If your subdomain shows all green, test from another network, try an incognito window, and check your own integrations/DNS before concluding it's Zendesk.
How do I get notified about Zendesk outages? On status.zendesk.com, check your subdomain, click Subscribe, enter your email, click Request setup link, confirm via the email, choose your products, and confirm the subscription. Email notifications are standard, with SMS available as an option.
What's the difference between "service degradation" and "service outage"? Per Zendesk's legend, service degradation (yellow) means intermittent or partial interruption — things are slow or flaky but largely working. Service outage (red) means the service is currently unavailable. Green means no issues.
The status page is green but Zendesk is broken for me — what now? That points to a local issue. Test from a different network and device, open Zendesk in an incognito window or another browser, clear your cache, and check whether a specific integration, your DNS/SSL, or a single feature is the only thing failing. A single broken feature with everything else green usually isn't a platform-wide outage.
Can I trust Downdetector to tell me if Zendesk is down? Use it as corroboration, not as the answer. Downdetector, IsDown, and StatusGator aggregate user reports and mirror Zendesk's components, which is helpful for spotting a widespread problem fast — but they're crowd-sourced. Confirm against the official status.zendesk.com for your subdomain.
The bottom line
When you're asking "is Zendesk down?", skip the guesswork and go to status.zendesk.com — then enter your subdomain, because Zendesk's pod architecture means an incident can hit your account while sparing others. Read the component legend (green = fine, yellow = degraded, red = outage), check for scheduled maintenance, and subscribe so the next incident finds you instead of the other way around. If your subdomain is green but things are still broken, work the elimination ladder — another network, an incognito window, your integrations and DNS — because half the time it's not Zendesk at all. And during a real outage, the move is to communicate early, leave your settings alone, and wait for the official "resolved." Anything that sits on top of Zendesk depends on Zendesk being up — so the best outage strategy is the boring one: know your pod, subscribe to status, and have a runbook ready before you need it.
Status page behavior, legend, pod concept, and subscription flow verified against Zendesk's official documentation, June 2026. Zendesk updates its products and UI periodically — confirm exact labels in your own status view.


