





 Shopify
 Stripe
 Slack
Slack Notion
 Google Workspace
 Confluence

How Do You Run and Build Reports in Freshdesk? Curated vs Custom (2026)


Freshdesk reports live under Analytics: curated reports are ready-made and read-only, and custom reports are built widget by widget with up to 10 filters and 2 group-bys each. Custom reports, scheduling and exports need the Pro or Enterprise plan.
Key takeaways
- To run a Freshdesk report, open Analytics from the left sidebar, pick a curated report such as Agent Performance, then set the date range and the Company, Group or Agent filters.
- Freshworks lists 13 curated Freshdesk reports in three themes, and each carries its own plan label, from Ticket Volume Trends on all plans to Top Customer Analysis on Enterprise only.
- Curated Freshdesk reports are read-only, so filters applied on the fly are not saved; keeping a change means cloning the report into an editable custom report.
- A custom Freshdesk report widget supports up to 10 filters and 2 group-bys, and Analytics data refreshes every 30 minutes on every plan.
- Freshdesk custom reports, scheduling and exports need the Pro or Enterprise plan, and scheduling applies only to custom reports, so a curated report must be cloned first.

To run a report in Freshdesk, open Analytics from the left sidebar, pick one of the curated reports (such as Agent Performance), set the date range and apply the Company, Group or Agent filters. To build your own, click New Report and drag widgets onto the canvas; each widget takes up to 10 filters and 2 group-bys. Custom reports, scheduling and exports need the Pro or Enterprise plan (Freshworks, introduction to Analytics, checked 24 September 2026).
| Plan | What you get in Analytics |
|---|---|
| Free | Basic curated reports only (Ticket Volume Trends) |
| Growth | Adds Helpdesk Performance and Helpdesk Ticket Volume; saving and cloning |
| Pro | Full curated set except Top Customer Analysis; custom reports, scheduling, exports |
| Enterprise | Everything, including Top Customer Analysis |
Where do reports live in Freshdesk?
Everything reporting-related sits under Analytics, reached from the Reports/Analytics icon in the left sidebar of your Freshdesk account. Open it and you land on a list of reports split into two families.
Curated reports are the ready-made ones. Freshworks' overview of curated reports lists 13 curated reports grouped into three themes: Track Helpdesk Health (Helpdesk Performance, Helpdesk Ticket Volume, Ticket Lifecycle, Ticket Volume Trends, Timesheet Summary, Canned Response Report, Knowledge Base), Monitor Performance Efficiency (Agent Performance, Group Performance, Performance Distribution, Average Handling Report), and Gauge Customer Impact (Customer Satisfaction Survey Results, Top Customer Analysis). Each carries its own plan label, so the set you see depends on your plan. You open one, read it, and move on.
Custom reports are the ones you build. You click New Report near the search bar and assemble a report widget by widget. The thing to know before you start: you can't add a widget to a curated report. New widgets only go on custom reports. If you want to modify a curated report, you clone it first (more on that below).
How do you run and read a curated report?
Start here, because it's fastest and it's usually enough.
- Open Analytics from the left sidebar and pick a curated report, say Agent Performance.
- Set the date range at the top. This is the most important filter; a report of "the last 6 months" tells a very different story than "yesterday."
- Apply the global filters across the top, commonly Company, Group and Agent, to narrow the whole report to the slice you care about.
- Read across the report's tabs. Agent Performance, for example, breaks out into Activity, Time, SLA %, Violations, Handling Time and Availability, each a different lens on the same agents.
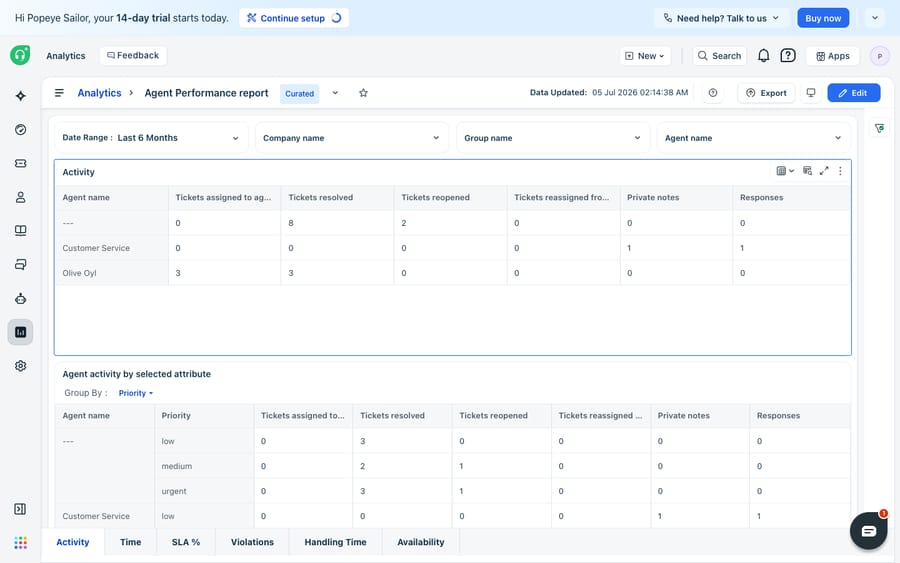
The widgets are the payload. A summary-table widget lists raw counts (tickets assigned, resolved, reopened, private notes, responses); a chart widget trends those counts over time; a metric tile shows a single headline number like "SLA % = 100%." Reading a report well is mostly a matter of knowing whether you're looking at a total, an average or a rate, a distinction we go deeper on in the Freshdesk metrics worth tracking.
Can you edit a curated report?
Not directly, and this is the part that trips people up. Filters you apply to a curated report on the fly aren't saved. Per Freshworks' comparison of curated versus custom reports, the way to make a lasting change is to clone the curated report, which drops an editable copy into your custom reports. From there you can add filters, add widgets and save it as your own. Freshworks' Analytics introduction lists saving and cloning from the Growth plan up.
So the mental model: curated reports are read-only templates. The moment you want to keep a tweak, you're building a custom report, just from a head start instead of a blank page.
How do you build a custom report from scratch?
When no curated report answers the question, build one.
- In Analytics, click New Report near the search bar. Name it using the editable field top-left.
- Open the Add Widgets panel on the right. You can start from a chart template in the gallery, or create from scratch with a blank Chart, Interactive Filter, Text or Image widget.
- Drag a widget onto the canvas. For a chart, pick your metric (for example Tickets created, Average resolution time, First response time), then choose how to show it: bar, line or table.
- Add filters to scope the data (for example Status is Resolved, Source is Email). Per the introduction to Analytics, you get up to 10 filters and 2 group-bys per widget.
- Add an Interactive Filter widget so viewers can slice the whole report themselves, and a Text widget to caption what they're looking at.
- Save, and optionally share it with colleagues to make it public to your team.
The builder rewards restraint: one clear question per report, two or three widgets that answer it, and an interactive filter so people can drill in. The custom-reports deep dive walks through building a specific report end to end if you want a worked example.
How do you read the widgets correctly?
The most common reporting mistake isn't a broken filter. It's misreading a widget. Three quick rules:
- Counts (tickets created, resolved, reopened) answer how many and are sensitive to the date range. Doubling the range roughly doubles the count, so always compare like-for-like windows.
- Averages (average resolution time, average handling time) answer how long and get skewed by outliers. One ticket that sat open for three weeks drags the whole average up. Watch for a median alongside it where the report offers one.
- Rates (SLA %, reopen rate, CSAT %) answer how often and are the ones to trend over time. A single week's SLA % is noise; the slope across twelve weeks is the signal.
Analytics data refreshes every 30 minutes on every plan, so a report won't reflect the ticket you closed thirty seconds ago. That's expected, not a bug.
Which Freshdesk plans include reports?
Plan gating is the biggest limit, and Freshworks' own pages describe it at two levels. The curated-versus-custom comparison lists curated and custom reports on the Pro and Enterprise plans (and on the classic Growth, Pro and Enterprise Omnichannel plans). The per-report labels are finer grained: Ticket Volume Trends is on all plans, Helpdesk Performance and Helpdesk Ticket Volume start on Growth, most of the rest need Pro, and Top Customer Analysis is Enterprise only. In practice, a Free or Growth account sees a handful of curated reports and no custom builder.
Scheduling, sending a report by email on a recurring basis, is Pro and Enterprise only and applies to custom reports only; to schedule a curated report you clone it first, which we cover in how to schedule reports in Freshdesk. Role permissions matter too: only the Manage analytics permission can touch schedules and exports, while View users can't edit anything.
What can't Freshdesk reports do?
Freshdesk's analytics are capable for a bundled reporting tool: the curated set covers the standard support questions, the custom builder is a real drag-and-drop canvas, and the widget library is broad. The deeper limit is conceptual. A report measures the past; it doesn't change the future. Analytics will tell you that 300 tickets came in about refunds last week, that first-response time crept up on Fridays, and that one agent's SLA % slipped. But the report can't read those refund tickets, understand each customer's situation and draft the replies. Every insight still lands on a human who has to go do the work the number describes.
That's the seam where an AI agent layer fits. The broader category of AI agents for customer service exists to do the work analytics can only point at. Macha is one such layer: it runs on top of the Freshdesk you already use as a native connector and doesn't replace your help desk or its analytics. You connect Macha to Freshdesk with your subdomain and API key, and it reads and writes the same tickets your reports count: drafting or posting grounded replies, triaging by intent so the categories in your reports are cleaner, and looking up order or account status through a custom tool that turns a REST API into something the agent can call. That's also how you automate Freshdesk with AI beyond what a static report can do. (Macha's connector is for Freshdesk specifically, not Freshchat, Freshservice or Freshcaller. Billing is per ticket, from $299 a month for up to 750 tickets, one charge per conversation however many messages it takes; see the pricing page.)
The clean division of labor: keep Freshdesk's reports as the source of truth for what happened, and layer an agent on top for the part a report can't do, which is acting on the volume it counts.
FAQ
Where do I find reports in Freshdesk? Open Analytics from the Reports/Analytics icon in the left sidebar. You'll see curated (pre-built) reports and, on Pro and Enterprise, the option to create custom reports via New Report.
What's the difference between curated and custom reports? Curated reports are ready-made and read-only: you can open and filter them on the fly, but you can't save changes. Custom reports are ones you build by dragging widgets onto a canvas and choosing metrics, filters and visualizations. To keep a change to a curated report, you clone it into a custom report first.
Are Freshdesk reports available on every plan? Partly. Ticket Volume Trends is on all plans and Growth adds Helpdesk Performance and Helpdesk Ticket Volume, but custom reports, most curated reports, scheduling and exports need Pro or Enterprise, and Top Customer Analysis is Enterprise only. Confirm against your own account.
How many filters can a report widget have? Up to 10 filters and 2 group-bys per widget. Analytics data refreshes every 30 minutes, so a report won't reflect a ticket you just changed.
Can I add AI to Freshdesk reporting without replacing Freshdesk? Yes. An AI agent layer like Macha connects to Freshdesk as a native connector and runs on top of your existing help desk and its analytics without replacing them. It acts on the volume your reports count by drafting grounded replies and triaging tickets by intent, while Freshdesk stays the system of record for what happened.
Ready to turn your report numbers into resolved conversations? Start a free trial of Macha with $50 of free usage and connect it to your Freshdesk in minutes.