





 Shopify
 Stripe
 Slack
Slack Notion
 Google Workspace
 Confluence

Why Are My Gorgias Stats Showing Wrong Numbers? 8 Causes and Fixes (2026)


Gorgias numbers that look wrong almost always trace back to documented counting rules: medians instead of averages, a 72-hour wait before a ticket counts as automated, excluded spam and merged tickets, and after-hours time in response metrics. Work through the causes in order and most teams reconcile the dashboard within the first three.
Key takeaways
- Gorgias reports first response time and resolution time as the median, not the average, which is the most common reason dashboard numbers don't match a spreadsheet export.
- Gorgias bills an interaction as automated only once 72 hours pass without a human handover, so the latest 3 days of Overview and AI Agent metrics lag.
- Gorgias statistics exclude deleted (merged), trash and spam tickets by design, so reported ticket volume can sit below the number of emails your inbox received.
- Gorgias first response time includes time outside business hours, so overnight and weekend gaps count against the metric unless you segment by business hours.
- Gorgias caps a date aggregation at 1 full year (365 days) and has no ticket handle-time data before 19 March 2024.

Gorgias stats usually look wrong for one of five documented reasons: the dashboard shows the median rather than the average, automation metrics wait 72 hours before counting a ticket as automated, spam, trash and merged tickets are excluded, after-hours time counts toward response times, and the date range or filters differ from what you're comparing against. None of these is a bug. Each one is written into Gorgias's own help center, and each one takes a minute to confirm.
| What you observe | Most likely cause | Where to check |
|---|---|---|
| Dashboard number ≠ your spreadsheet | Median vs. average | How metrics are calculated |
| Automation rate too low right after launch | 72-hour rule before a ticket counts as automated | Overview / AI Agent report (metrics marked *) |
| Two numbers for the same days disagree | One metric is delayed 72 hours, the other updates immediately | Pick one source of truth |
| Volume lower than raw inbox | Spam, trash and merged tickets excluded | Spam view + merge rules |
| Response time shockingly high | After-hours time included | Segment by business hours |
| Voice channel "missing" from stats | Phone counted in handle time / Voice report | Voice / Live reports |
| Handle time reads zero for old dates | No handle-time data before 19 March 2024 | Date-range selector |
Are your filters, date range, or channel changing the number?
Check scope before you distrust the math. The most common reason a Gorgias number "looks wrong" is that it's answering a narrower or wider question than you think. Every analytics view carries filters for channel, agent, and date range, and a stray selection reshapes every KPI on the page.
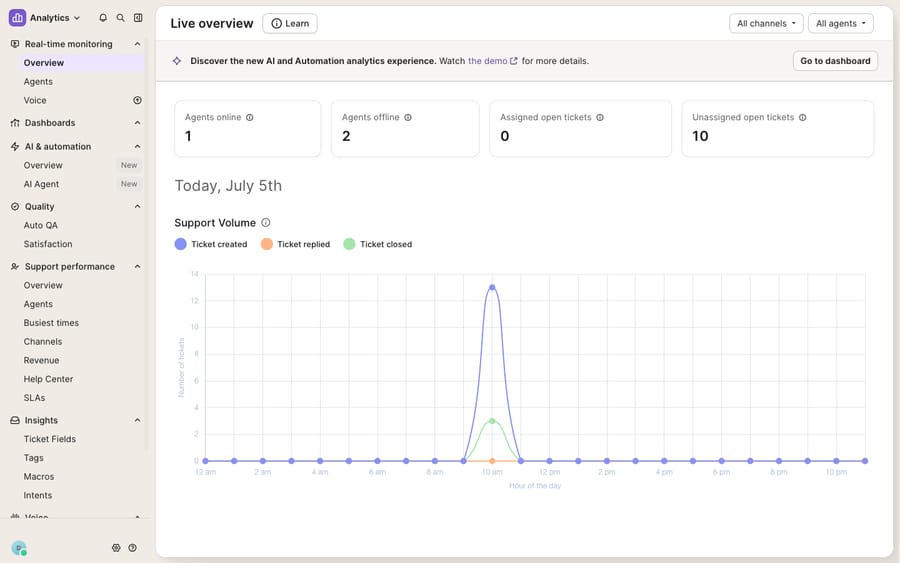
The Analytics Live overview with the "All channels" and "All agents" filter dropdowns top-right, the scope controls that most often explain a "wrong" number. Confirm channel, agent, and date range match the question you're asking before you dig deeper. (Live overview shown here; this view reflects current state, not a reproduced error.)
Reset the date range to the exact period you're comparing against, set channel and agent back to "All," and re-read the figure. If it now matches, you were comparing two different scopes. If it still looks wrong, work down the list below.
What causes wrong numbers in Gorgias reports?
Here's the ranked checklist. Each item is a documented Gorgias behavior, and each is quick to confirm.
- You're reading a median, not an average. This is the biggest "why doesn't this match my spreadsheet" trap. Gorgias reports first response time and resolution time as the median, not the mean, to minimize the impact of extreme values. If you export raw ticket timestamps and average them, your number will almost never equal the dashboard's, because one 40-hour outlier drags a mean but barely moves a median. The dashboard isn't wrong; you're computing a different statistic. Compare median to median.
- Automation numbers wait 72 hours. Gorgias's AI and automation metrics page says an interaction is only billed as automated once 72 hours have passed without a human handover, so the most recent 3 days aren't reflected yet. The delay applies to the metrics marked with an asterisk in the Overview and AI Agent reports: automated interactions, cost saved, success rate and time saved. A launch-day spike won't show its true automated share until the window clears, so wait out the 72 hours before judging a new AI Agent.
- Two numbers for the same period disagree. Most Gorgias statistics update immediately; the help center's Statistics 101 says every action should reflect right away. The asterisked automation metrics don't. Put a ticket count for the last three days next to an automated-interaction count for the same days and they will disagree, because they follow two counting rules. That's also the incentive behind the rule: automated interactions are what Gorgias bills for, so it holds them back until a human handover is ruled out. Pick one report as the source of truth for each metric and stop reconciling across both.
- Spam, trash, and merged tickets are excluded by design. Per Statistics 101, Gorgias metrics exclude deleted (merged), trash, and spam tickets. Spam emails caught by your rules land in the Spam view and are never counted. That's usually what you want, but if volume looks lower than your raw inbox, aggressive spam auto-close or a broad merge rule is the likely reason. Spam that escapes your filters and reaches the main queue will count and inflate volume. Reconcile against your Spam view before assuming under-reporting.
- Reopened and snoozed tickets skew closed-ticket counts. A reopened ticket has no handle time until it's closed again and drops out of resolution time, and a snoozed ticket counts toward the closed count until it's reopened. A queue full of reopens and snoozes can make "resolved" figures wobble between refreshes even though nothing changed operationally. If closed counts look unstable day to day, check how many tickets are bouncing between closed, snoozed, and reopened.
- After-hours time is baked into your response times. Gorgias states that outside business hours are included in first response time and resolution time. If your team works 9 to 5 but tickets arrive at midnight, the overnight gap counts against your FRT unless you're reading a business-hours-aware view. An alarming response time is often weekend and overnight dead time, not slow agents. Segment by business hours before you act on it.
- Phone tickets aren't in the counters you expect. For phone tickets, handle time is the sum of call duration and ticket-viewing time, and the timer pauses when an agent switches tabs. Voice activity is surfaced in the dedicated Voice / Live reports rather than folded into standard email and chat response-time stats. If you run a voice channel and your response-time report seems to ignore it, check the Voice report for call metrics like average wait time.
- Your date range reaches past the data. The maximum date aggregation range is 1 full year (365 days), and Gorgias only began tracking ticket handle time on 19 March 2024, so no handle-time data exists before that date. If a metric reads zero or a year-over-year comparison looks impossibly clean, check whether the period you picked falls outside those limits. Export on a schedule if you need longer comparisons than one query allows.
Which fixes need extra setup or a paid channel?
Most of the fixes above cost nothing but attention: reset a filter, compare median to median, wait out the 72 hours. Two have prerequisites. Business-hours-aware reporting depends on having your schedule configured, and Voice metrics only exist if you run the Gorgias phone channel. No connected store or custom domain is required to reconcile the email and chat numbers covered here, and a trial account shows the same statistics engine. For the tour of every panel, see Gorgias stats and reporting explained; for how satisfaction is measured, Gorgias CSAT explained covers the survey side, and if you're newer to the platform, what is Gorgias sets the context.
Can an AI agent improve the numbers behind the report?
The dashboard can't fix one thing: a lot of "wrong numbers" anxiety is really volume anxiety. Response-time medians balloon because repetitive tickets pile up overnight, and automation rates disappoint because rules only deflect the tickets whose exact wording you anticipated. That's where an AI agent for customer service helps, not by editing your reports but by removing the ticket volume that made them look bad. Macha is one such layer. It runs on top of the Gorgias you already use: it connects to your help desk and reads and writes the same tickets, replies, and tags your team works. It resolves the repetitive tickets before they age into your response-time median, so the numbers improve because the underlying queue did. For how the reasoning works, see the Gorgias AI agent explained.
Because an agent acts on meaning rather than a fixed keyword, you can't just eyeball it. Macha lets you grade a candidate agent against your real historical Gorgias tickets before it touches a live queue, and you can extend what it does through a custom tool that turns any REST API into an action the agent can call, such as checking order or shipping status mid-conversation. That lookup turns a WISMO ticket into an instant answer instead of another line in your volume chart. Macha's pricing starts at $299 a month for up to 750 tickets and is billed per ticket, not per resolution, so the cost tracks the volume you handle rather than an outcome definition you don't control.
FAQ
Why don't my Gorgias reports match my own exported numbers? Almost always because Gorgias reports first response time and resolution time as the median, not the average. If you export ticket timestamps and take a mean, a single long outlier pulls your number away from the dashboard's median. Compare median to median and the gap usually disappears.
Why is my automation / AI Agent rate lower than it should be? Gorgias counts an interaction as automated only once 72 hours pass without a human handover, so the latest 3 days of automation stats lag. Right after a launch, wait out the window before judging the number. Other statistics update immediately, which is why a fresh ticket count won't line up with the automated count for the same days.
Why is my ticket volume lower than the emails I actually received? Gorgias statistics exclude deleted (merged), trash, and spam tickets by design; spam caught by your rules goes to the Spam view and is never counted. If volume looks too low, check whether spam auto-close or a broad merge rule is removing more than you expected.
Why does my response time look so high? Because outside business hours are included in first response time. Overnight and weekend gaps count against your FRT unless you segment by business hours. The number often reflects dead time, not slow agents.
How far back does Gorgias reporting go? A single query can aggregate at most 1 full year (365 days), and handle-time data starts on 19 March 2024. If you need longer comparisons, export on a schedule and stitch the periods together yourself.
Ready to stop fighting your response-time median and shrink the volume behind it? Start a free trial and grade a Macha agent against your own Gorgias history before it goes live.