





 Shopify
 Stripe
 Slack
Slack Notion
 Google Workspace
 Confluence

How Do You Set Up Front Analytics and Reports? (2026)


Front analytics runs on three pre-built reports, Workload, Resolution and Time goals, which you save as views and can email on a schedule with CSV attachments. Workload is on every plan, while Time goals and scheduling need Professional and custom reports need Enterprise.
Key takeaways
- Front analytics is set up under Analytics, Analytics reports, where the pre-built Workload, Resolution and Time goals reports are filtered by inbox and period and saved as views.
- Front's Workload report is on every current plan and lets you pin up to three key-metric cards drawn from Volume, Efficiency, Tasks and Calls metrics.
- Front's Time goals report needs the Professional plan or above and stays empty until you create time-goal rules, because it measures performance against those rules.
- Scheduled Front report emails go out daily, weekly or monthly on Professional or above, with CSV attachments of each table plus the charts in the email body.
- Front lists custom reports only on Enterprise at $105 a seat a month, while Professional at $65 a seat covers Time goals and scheduled delivery.

To set up Front analytics, open the Analytics tab, choose Analytics reports, and configure three pre-built reports: Workload (on every Front plan), Resolution, and Time goals (Professional or above, and only after you create time-goal rules). Save each as a view, then schedule it by email with CSV attachments, which also needs Professional, listed at $65 a seat a month on Front's pricing page. Fully custom reports are an Enterprise feature ($105 a seat a month).
| Report | Answers | Key widget to watch | Setup prerequisite |
|---|---|---|---|
| Workload | Are we staffed and efficient? | Workload-over-time graph + heatmap | None (all plans) |
| Resolution | Where do conversations stall? | Time-in-status, broken down by tag | Consistent tagging |
| Time goals | Are we hitting SLA targets? | Met time goal % + by-rule table | Professional plan; time-goal rules created first |
| Scheduled delivery | Who gets the numbers, and when? | Email with charts + CSVs | Professional plan; a saved view |
Where do Front analytics live?
Front's reporting sits in one place. Open the Analytics tab from the left rail, then choose Analytics reports to see the pre-built reports. Per Front's Workload report documentation, the three you'll use most are:
- Workload: is the team staffed for the volume it's getting, and how efficient is it.
- Resolution: how long conversations spend in each status, so you can find where things stall.
- Time goals (formerly the SLAs report): are you meeting the reply and resolution targets you've committed to.
Each report opens as a view you can filter by inboxes and time period at the top. A view is the unit you save, pin, and later schedule, so build it deliberately rather than eyeballing the default. For a conceptual tour of how these reports fit together, Front analytics explained covers the model; this guide is the hands-on setup.
How do you set up the Workload report?
The Workload report answers the staffing question, and Front's docs say it's included on all current plans. Its widgets draw on four metric groups, and knowing which group a metric lives in saves you hunting.
- Open Analytics → Analytics reports → Workload. Set the time period (last 7 or 30 days is a sane default) and the inboxes you care about at the top of the view.
- Configure the key-metric cards. Front lets you pin up to three cards, each showing a current measurement plus its period-over-period change. Pick the ones your team is judged on, commonly first reply time, resolution time, and new conversations.
- Choose your metrics from the right group. Per Front's docs, metrics are grouped as Volume (new conversations, messages received and sent), Efficiency (resolution time, reply time, first reply time, handle time), Tasks (new tasks, resolved tasks, task resolution time), and Calls (inbound and outbound calls, abandonment, queue and hold times).
- Read the "Workload over time" graph. This is the volume-peak view. Use the toggle to compare against the previous period, or group by your top 5 inboxes or tags to see where the spikes come from.
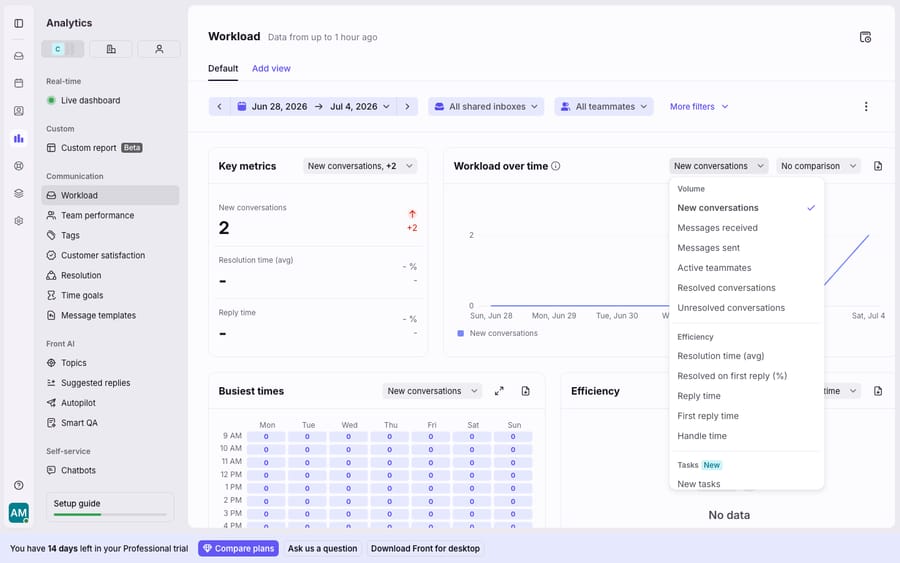
- Use the busiest-times heatmap for shift planning. It shows workload by hour and day, defaulting to a 9 AM to 5 PM window that you can expand to a full 24 hours. Useful if you're deciding when to add coverage.
- Compare people and inboxes in the workload-by-inbox table. This is where teammate load surfaces: outliers in reply time or conversation count stand out against the rest of the row.
A note on the screenshot above: the metric picker shown is the real, ungated customization you get on a Professional trial. You can swap any listed metric into the chart. What you can't do on that plan is build a fully Custom report, which Front's pricing page reserves for Enterprise. So "customizing analytics" in Front means two different things at two price points, $65 and $105 a seat, and it's worth knowing which one you're being sold.
How do you set up the Resolution report?
The Resolution report tells you where conversations get stuck. It breaks down how long conversations spend in each status, and, the part most teams miss, you can break resolution metrics down by tag. Tag your billing, shipping, and bug conversations and the Resolution report shows which category is dragging your average up. If your tagging is thin, that breakdown is thin too; see Front shared inbox explained for how tags and inboxes structure the underlying data.
Why is the Front Time goals report empty, and how do you fill it?
The Time goals report is the SLA scoreboard, and it has a prerequisite people forget. Per Front's Time goals report documentation, it's available on the latest Professional plan or above, and it only populates once you've created time-goal rules. The report measures against those rules; it doesn't invent targets. So define your reply and resolution targets as rules first, then the report has something to measure.
- Create your time-goal rules (reply time and/or resolution time targets) before opening the report.
- Open the Time goals report. Read the top key-metrics chart, which shows up to three of Met time goal %, Messages with time goal, Overdue time goals, At risk time goals, and Overdue time (avg).
- Drill into the "Time goal by rule" table. Use the dropdown on that table to switch between reply time goals and resolution time goals; the same table serves both.
- Track the trend line. The performance-over-time graph shows whether your met-goal percentage is drifting, with an option to compare to a prior period.
For the mechanics of targets, business hours, and how "overdue" is computed, Front SLA explained goes deeper than we can here.
How do you schedule and export Front reports?
A dashboard nobody opens is worthless. Front can push reports out on a cadence on the Professional plan or above, per its Schedule analytics reports documentation. The order of steps trips people up, so follow it.
- Build and save the view first. Filter the report exactly how you want it (inboxes, time period, metrics), then save it. You schedule off a saved view, not off an ad-hoc screen.
- Pin or open that saved view so it's the one on screen.
- Open the three-dot menu at the top-right of the view and choose Schedule email delivery.
- Add recipients: internal teammates or external stakeholders are both allowed.
- Pick a frequency: daily, weekly, or monthly.
The first email goes out the next day (daily), the next Monday (weekly), or the first of next month (monthly), sent between 12:00 and 1:00 AM in your time zone. It contains CSV attachments of the raw data from each table in the report, plus the charts in the email body, so recipients get both the picture and the spreadsheet. To change or stop it later, reopen the three-dot menu on the pinned view and choose Edit email delivery or Stop delivery.
What can't Front analytics do?
Front's native analytics do their job well: they turn shared-inbox activity into staffing, efficiency, and SLA numbers without a data warehouse, and the scheduled CSV export saves real time.
The ceilings are plan-shaped. On Starter ($25 a seat) you get the Workload report but not Time goals or scheduled delivery. Time goals and scheduling need Professional, and Time goals stays empty until you've built rules, so "turn on SLA reporting" is really two projects. Custom reports need Enterprise. And structurally, analytics is a rear-view mirror. It tells you the first reply time was 6 hours and the SLA slipped, after it slipped. It can't read the conversation and shorten the queue.
That's where an AI agent fits: not to replace Front's reporting, but to change the numbers it reports. The broader category of AI agents for customer service handles the routine volume that inflates reply-time and workload charts. Macha is one such layer. It runs on top of the Front you already use through the Macha–Front connector and doesn't replace Front, your inboxes, or your analytics. Your reports keep measuring; Macha's agent reads incoming conversations, works out intent rather than matching keywords, and drafts or sends replies, pulling a real order or account status through a custom tool that turns your REST API into something the agent can call. Fewer routine tickets aging in the queue means a healthier Workload graph and a higher met-goal percentage. Connecting Front to Macha to route conversations to AI walks through the wiring. Macha fits teams on Zendesk, Freshdesk, Gorgias, Front, HubSpot or Intercom and bills per ticket, from $299 a month for up to 750 tickets: one conversation is charged once however many messages it takes, never per resolution, so the bill doesn't hang on an outcome definition you don't control.
Let Front analytics be the scoreboard, and put an agent on the queue so the scoreboard improves because the work got done. For plan-by-plan detail on what unlocks where, Front pricing explained lays it out.
FAQ
Where do I find analytics in Front? Open the Analytics tab in the left rail, then Analytics reports. From there you can open the pre-built Workload, Resolution, and Time goals reports, filter each by inbox and time period, and save the result as a view.
Why is my Front Time goals report empty? Because it reads against time-goal rules you haven't created yet. The report doesn't set targets; it measures performance against the reply-time and resolution-time rules you configure first. Build those rules, and the report populates. It also needs the Professional plan or above.
Can I schedule Front reports to email automatically? Yes, on Professional or above. Save the view you want, pin or open it, then use the three-dot menu → Schedule email delivery, add recipients, and pick daily, weekly, or monthly. The email includes CSV attachments of each table plus the charts in the body.
Is Front's custom report builder available on every plan? No. The Workload report is on every current plan, Time goals and scheduled delivery need Professional, and Custom reports are listed only on Enterprise.
Can I improve the numbers, not just measure them, with AI? Yes. An AI agent layer like Macha connects to Front and runs on top of your existing inboxes and analytics. It handles routine incoming conversations so fewer tickets age in the queue, which is what moves your Workload and met-goal charts in the right direction.
Ready to make your Front reports read better because the work got done? Start a free trial of Macha and connect it to your Front in minutes.