





 Shopify
 Stripe
 Slack
Slack Notion
 Google Workspace
 Confluence

How Does Front Analytics Work? Reports, Metrics and Plan Limits (2026)


Front analytics turns every conversation in a shared inbox into counts, reply times and SLA results across 11 separate reports. Used carelessly, it tells a confident story built on counts that one outbound sequence can inflate.
Key takeaways
- Front analytics is a set of 11 separate reports, including Live dashboard, Workload, Team performance, Tags, Resolution and Time goals, rather than one combined dashboard.
- Front's Resolution report requires the Professional plan or higher plus ticketing enabled, and the Time goals report also requires Professional, listed at $65 a seat per month.
- Front's Starter plan gets basic analytics, Professional gets advanced analytics, and Enterprise at $105 a seat adds custom reports with Smart QA and Smart CSAT included.
- New conversations counts conversations opened in a period while resolutions counts conversations closed, so the two numbers describe different events and rarely match.
- Sending an outbound sequence through a shared Front inbox counts each outbound message toward the New conversations and Active conversations metrics, inflating both.

Front analytics is a set of 11 separate reports under Analytics in the left navigation, led by the Live dashboard, Workload, Team performance, Tags, Resolution and Time goals (SLA) reports. Starter gets basic analytics, Professional ($65 a seat per month, up to 50 seats) gets advanced analytics plus the Resolution and Time goals reports, and Enterprise ($105 a seat) adds custom reports (front.com/pricing, checked 24 September 2026).
| Report | What it answers | Plan availability |
|---|---|---|
| Live dashboard, Workload | What's open right now, and how much work arrived | Latest plans (Starter access limited) |
| Team performance, Tags | Who's carrying the load, which topics eat the time | All latest plans |
| Resolution report | How long conversations sit in each ticket status | Professional+ and ticketing enabled |
| Time goals (SLA) report | Which reply-time goals you meet or miss | Professional+ |
| Custom reports | Your own report layouts | Enterprise |
| Smart QA, Smart CSAT | AI-scored quality and satisfaction | Add-on on Starter and Professional; included on Enterprise |
Which reports does Front analytics include?
Front's analytics opens from the left navigation → Analytics and fans out into a set of reports rather than one giant dashboard. Per Front's Understanding Analytics overview, the core reports are:
- Live dashboard: a real-time view of open and unassigned conversations, for spotting a queue backing up before it becomes a fire.
- Workload report: the volume view, with counts of sent and received messages, resolution figures and a busiest-times heatmap so you can see when the wave hits.
- Team performance report: reply times, handle time, participation and a per-teammate breakdown of who is carrying how much.
- Tags report: tagged versus untagged conversations, plus how much traffic and time each tag category consumes.
- Resolution report: how long conversations sit in each ticket status, replies-to-resolution and first-reply time.
- Time goals report (formerly the SLAs report): met time-goal percentage, overdue and at-risk counts, and average overdue time.
Alongside those sit Customer satisfaction (CSAT), Message templates, Smart QA, Chatbots (which also covers AI Answers) and Knowledge base reports, for 11 in total. Front says analytics "are available on all the latest plans" and that "the latest Starter plan has limited access."
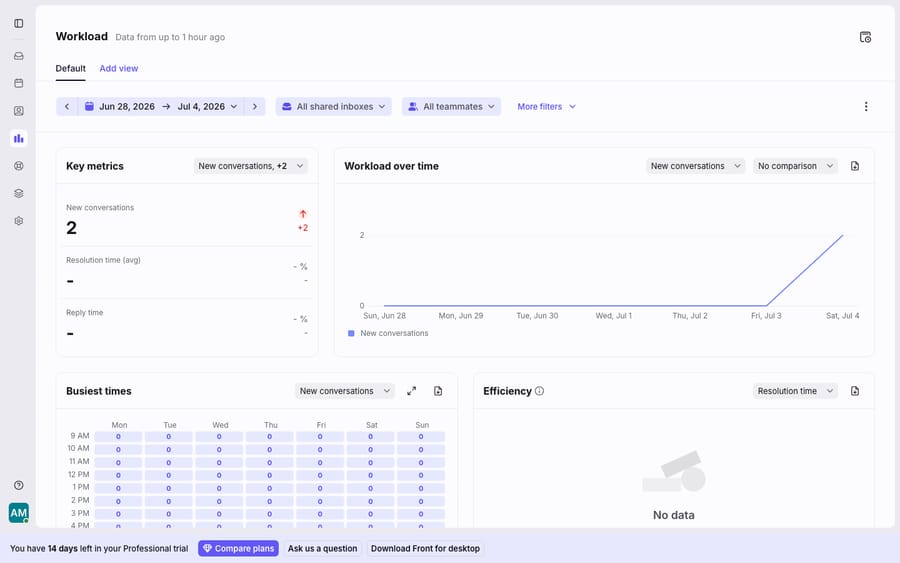
On a brand-new account the dashboard looks half-empty on purpose. With no history yet, the Efficiency panel reads "No data" and most key metrics show a dash. That's the fresh-trial state, not a broken report; the numbers fill in as conversations accumulate.
What's the difference between "new conversations" and "resolutions"?
The most misread pair of metrics in Front is new conversations and resolutions, because they sound like they should net out and they don't.
- New conversations counts conversations that were opened in the reporting window, driven by inbound messages arriving in an inbox. It's a demand signal: how much work showed up.
- Resolutions (and resolution time in the Resolution report) counts conversations that were closed, meaning archived or moved to a closed ticket status. It's a throughput signal: how much work got finished.
Both are measured over the same period but describe different events, so a day can show more new conversations than resolutions (you're falling behind) or the reverse (you're clearing a backlog). Front's Resolution report goes further, breaking down how much time conversations spend in each ticket status and comparing resolution by tag, so you can see whether "billing" cases resolve slower than "shipping" ones. Reading new-conversation volume as if it were resolution volume is the classic way to draw the wrong conclusion from an otherwise honest dashboard.
How do the Team performance, Tags and Time goals reports work?
Beyond raw volume, three reports answer the questions leads actually ask.
Team performance is the capacity view. Per Front's Team performance report, it covers 24 metrics, including replies sent, reply time, handle time (how long a teammate actively works a conversation with it open), touched and assigned conversations, and CSAT, all sliceable down to the individual teammate. One nuance worth knowing: Front says the table "contains all teammates involved in the conversations" you filter to, not just the official assignee. If one person is assigned and another jumps in to answer, both show up against that thread.
Tags turns your labelling discipline into an operations report. If your team tags well, the Tags report shows how much traffic and time each category demands and which tags resolve slowest, which is why consistent Front tags are the difference between a useful analytics view and noise.
Time goals (the report Front used to call SLAs) is the accountability view. Per the Time goals report docs, it shows five headline metrics (met time goal %, messages with a time goal, overdue and at-risk time goals, and average overdue time) plus a time goal by rule table, so you can see exactly which goal you keep missing. Front says the report is available on the latest Professional plan or above, and the underlying reply-time goals are enforced through Front rules, not a separate SLA product.
Which Front analytics features need a higher plan?
Analytics is one of the areas where Front's plan tiers show up most. Front's pricing page lists three current plans: Starter at $25 a seat per month (up to 10 seats), Professional at $65 (up to 50 seats) and Enterprise at $105, and advertises a 24% saving on annual billing.
- Starter gets "basic analytics": limited access, not the full report suite.
- Professional gets "advanced analytics". The Resolution report needs Professional or higher and ticketing enabled, because resolution is tracked by ticket statuses or a conversation stages rule. The Time goals report is also Professional and above.
- Enterprise adds custom reports and includes AI Copilot, Smart QA and Smart CSAT, which are paid add-ons on Starter and Professional.
Some legacy plans also keep access to these reports, so an older account may see more than its current plan name suggests. If you're weighing which tier you need, Front's pricing tiers lay out where each report unlocks. Don't assume the trial you're on shows everything the paid plan will.
Why does an outbound sequence inflate Front's conversation counts?
This is the caveat that quietly corrupts otherwise-clean numbers. If your team runs outbound sequences through a shared email address, Front's analytics counts each of those messages against your volume. Per Front's Analytics FAQs, when you send a sequence from a shared address, "analytics will count each individual outbound message towards the shared inbox's New conversations metric, which also rolls up into the Active conversations metric."
So a 500-recipient outreach sequence doesn't just send 500 emails. It can add up to that many to your New conversations count and inflate Active conversations with it. A support lead glancing at "new conversations spiked 3x this week" might conclude demand exploded, when sales fired a campaign through the shared channel. The same FAQ notes a second source: when a teammate is deleted, their conversations become unassigned, and the Active conversations metric rises for that window because it counts the unassign action. Neither is a bug; both are counting rules you have to know to read the dashboard correctly.
The wider limit is one every analytics tool shares: reports describe the past, they don't act on it. Front can tell you resolution time is climbing and the billing tag is your slowest queue, and then the work of replying to those conversations still lands on a human. Analytics measures the gap; it doesn't close it.
How can an AI layer move the numbers Front measures?
Closing the gap is the job an AI agent fills, not by replacing Front's analytics but by moving the numbers the analytics is measuring. The broader category of AI agents for customer service exists to do the reasoning-heavy resolution work that a report can only ever count.
Macha is one such layer. It runs on top of the Front you already use through the live Macha–Front connector. It does not replace Front, your shared inboxes, your rules or your reporting. When your Time goals report flags a queue that keeps breaching, Macha's agent reads those conversations, works out what the customer is asking, and drafts or sends a grounded reply, pulling a real order or account status through a custom tool that turns your REST API into something the agent can call. The result shows up in the same dashboards: resolution time falls, met-time-goal percentage rises, the billing tag stops being your slowest lane. For the mechanics, connecting Front to Macha to route conversations to AI walks through it. Macha bills per ticket, starting at $299 a month for 750 tickets: one conversation, charged once however many messages, lookups and drafts it takes, never per resolution.
The clean division of labour: let Front analytics be the honest scorekeeper, and layer an agent on top to move the score. For how the pieces fit, see the Front shared inbox model and Front tags explained; good tags are what make the analytics worth reading.
FAQ
Where do I find analytics in Front? From the left navigation → Analytics. It opens into a set of reports (Live dashboard, Workload, Team performance, Tags, Resolution, Time goals and others) rather than one combined view. Analytics is on all of Front's latest plans, with limited access on Starter.
What's the difference between "new conversations" and "resolutions"? New conversations counts conversations opened in the period (inbound demand). Resolutions counts conversations closed, archived or moved to a closed ticket status (throughput). They're measured over the same window but describe different events, so they rarely match.
Which Front analytics reports are plan-gated? Starter gets basic analytics. The Resolution report needs Professional or higher plus ticketing enabled. The Time goals (SLA) report is Professional and above. Custom reports are Enterprise only. See Front pricing explained for what unlocks where.
Why did my "new conversations" number suddenly spike? Often a sequence. Per Front's Analytics FAQs, sending an outbound sequence through a shared email address counts each individual outbound message toward the shared inbox's New conversations metric, which also rolls up into Active conversations, so a campaign can inflate both without any real jump in inbound demand.
Can I improve the numbers in Front's reports without replacing Front? Yes. An AI agent layer like Macha connects to Front as a live connector and runs on top of your existing inboxes, rules and analytics. Your reporting keeps scoring honestly; the agent resolves the flagged conversations, so resolution time and met-time-goal percentages improve in the same dashboards.
Ready to move the numbers your Front reports are measuring? Start a free trial of Macha and connect it to your Front in minutes.