


 Intercom
 Shopify
 Stripe
 Slack
Slack Notion
 Google Workspace
 Confluence

Customer Service Benchmarks (2026): First Response Time, Resolution Time, Handle Time, CSAT and FCR


On Freshworks' own customer data, the median first response time on support tickets is about one hour, according to its Customer Service Benchmark Report 2025, built from 1.2 billion tickets across more than 32,000 companies in 2024. The top 20% of teams reply in 3 minutes 10 seconds and the median resolves a ticket in 6 hours 15 minutes. On Gorgias's own data, ecommerce brands at $10M GMV are slower, with a 6.3-hour median first response. On the phone, SQM Group puts average first call resolution at 70% and average handle time at 697 seconds. These are the measured benchmarks available in 2026, with the definition and population behind each, plus what controlled studies show AI does to them.
Key takeaways
- Freshworks' 2025 benchmark of 1.2 billion tickets from its own customers puts median first response time on tickets at 1 hour, the top 20% at 3 minutes 10 seconds and the bottom tier at 7 hours 4 minutes.
- Gorgias Ecom Lab's data on its own merchants found an all-industry median first response time of 6.3 hours for ecommerce brands at $10M GMV, from 1.6 hours in hardware to 8.8 hours in apparel.
- SQM Group's 2025 research puts average first call resolution across industries at 70%, and its benchmark found only 5% of call centers reach the 80% world-class standard.
- SQM Group's benchmarked call centers averaged a 697-second handle time including wrap-up, an 18% increase from the previous year.
- The Quarterly Journal of Economics study of 5,172 agents found AI assistance raised issues resolved per hour by 15% on average, with no significant change in customer satisfaction as measured by net promoter scores.
What is a good first response time for customer service?
It depends on the channel more than on anything else. These are the measured figures we could verify, with who they describe. This page is one topic in our customer service and AI statistics hub.
| Channel and population | Benchmark | Source |
|---|---|---|
| Tickets, Freshworks customers | Top 20%: 3m 10s. Median: 1h. Bottom tier: 7h 4m | Freshworks Benchmark Report 2025, p.27 (2024 data) |
| Messaging, Freshworks customers | Top 20%: 10s. Median: 41s. Bottom tier: 4m 42s | Freshworks, p.26 |
| Live chat, LiveChat customers | 35 seconds typical; 55 seconds in retail | LiveChat Customer Service Report (2024) |
| Ecommerce brands at $10M GMV, Gorgias | 6.3 hours all-industry median; 1.6h hardware to 8.8h apparel | Gorgias Ecom Lab (April 2026) |
| Ecommerce pre-purchase questions, Gorgias | 22 seconds with AI Agent; 11 hours in the human queue | Gorgias Ecom Lab (May 2026) |
Every row here is vendor platform data: a help desk measuring its own customers. Freshworks defines first response time as "Time a customer waits for the first agent reply, excluding automated messages," so an AI reply doesn't count toward its figure, while Gorgias's 22-second figure is the AI Agent's own first reply. Freshworks labels its tiers Trendsetters (top 20th percentile), Performers (median) and Aspirants (the rest).
Gorgias's data shows how far the ecommerce median hides. "A Hardware brand responding in 1.6 hours and an Apparel brand responding in 8.8 hours are both measured against the same average," its researchers write. On pre-purchase questions handled by humans, "61% of human-handled pre-purchase questions wait more than two hours, and 22% wait a full day or longer." Timing matters as much as vertical: "During business hours, the median first response to a pre-purchase question is 2.2 hours. After hours, it stretches to about 15 hours" (Gorgias). Gorgias's own summary of the same study says 16 hours; its article text says about 15, and we use the article's figure. Our ecommerce statistics cover that segment in more detail.
Gorgias also reports first response time by how much a brand automates: "Brands automating near 0% respond in 736 minutes on average. At 20% automation, that drops to 400, roughly half. At 30%, it falls to 80 minutes. At 40%, 12 minutes" (Gorgias). That's correlation across brands, and brands that automate more may differ in other ways. A before-and-after cut on the same brands is stronger: the median first response time was "cut in half after AI Agent enablement," comparing the 30 days before with days 60 to 120 after (Gorgias).
Queues cost customers too. LiveChat's data shows "Customers waited in line an average of 4 minutes and 18 seconds before reaching an agent," and "The queue dropout rate was 27.4%." Our expectations statistics cover how fast customers say they expect a reply.
How long does it take to resolve a support ticket?
On Freshworks' ticket data, the median resolution time is 6 hours 15 minutes. The top 20% resolve in 31 minutes 59 seconds and the bottom tier takes 36 hours 3 minutes. Reopen rates run 1%, 5% and 14% across the same three tiers. Freshworks' "Resolution rate" in the same report means the "Percentage of total tickets successfully closed," by anyone, so it isn't an AI metric.
Channel changes resolution time as much as it changes first response. Gorgias's per-channel data on its own customer accounts with 30 or more tickets (last 90 days) found "Chat is 38x faster than email on first response, 8x faster on resolution. CSAT on chat is 2.5 points lower than email" (Gorgias). Across 14 ecommerce verticals, "Resolution time varies by 1.5x."
The slowest tickets are often the ones that start with AI and end with a person. Gorgias measured a "10hrs median shopper wait the moment a ticket crosses to a human," and by channel: "Contact form handoffs resolve 36 hours after handoff and abandon 42% of the time. Email handoffs resolve in 32 hours, abandon 30%. Chat resolves in 8 hours and abandons 13%" (Gorgias). A fast AI first reply followed by a 32-hour human wait still reads as slow to the customer.
What is a good average handle time?
For phone support, SQM Group's benchmark of more than 500 North American call centers reports that "the average AHT (including talk time and wrap-up time) for call centers participating in our benchmarking study is 697 seconds, reflecting an 18% increase from the previous year" (SQM Group, 2024 benchmark). That's about 11.6 minutes a call. SQM doesn't say why it rose.
For chat, LiveChat's platform data shows "The average chat lasted 8 minutes and 25 seconds," with agents "managing 84.1 chats per day." In Alibaba's Taobao operation, human workers handled 3.14 concurrent chats on average.
Handle time is the benchmark AI moves most in controlled studies:
| Study | Effect on handle or response time | Population |
|---|---|---|
| Brynjolfsson, Li and Raymond, NBER working paper (2023) | "a 3.8 minute decrease in the average duration of customer chats, a 9% decline" | 5,179 chat agents at one software firm, with an AI suggestion tool |
| Alibaba agentic AI experiment (preprint, 2026) | Chat duration down 16.8% on AI-eligible chats, and 64.6% on chats the AI handled alone | 647 Taobao workers, 680,676 chats |
| Alibaba AI drafting assistant (preprint, 2026) | Issue identification time down 8.2% and chat duration down 1.1% for agents given access | 5,940 new agents, about 2.56 million chats |
| Zhang and Narayandas, Management Science (2026) | "22% Drop in response times" (agent response time, not chat length); 70% for less-experienced agents | 138 agents at a meal delivery company |
A tool that suggests replies to a human (NBER, Alibaba's assistant) trims minutes. An agent that handles the chat itself (Alibaba's agentic experiment) cuts most of it, and the next section shows what that did to ratings.
What is a good CSAT score?
Benchmarks vary so much by scale and survey method that a single "good" number doesn't exist. What we could verify:
| Population | CSAT | Source |
|---|---|---|
| Tickets, Freshworks customers | 98.9% top 20%; 87.7% median; 62.7% bottom tier | Freshworks, p.27 |
| Messaging, Freshworks customers | 99.58% top; 96.22% median; 88.40% bottom tier | Freshworks, p.26 |
| Live chat, LiveChat customers | "the CSAT score averaged 64.2%"; 64.7% on chatbot-handled chats | LiveChat (2024) |
| Ecommerce pre-purchase tickets, Gorgias | 86% positive in business hours, 85% after hours | Gorgias (July 2026) |
| US national satisfaction (ACSI) | 76.9 out of 100 in Q4 2025 | ACSI |
| UK national satisfaction (UKCSI) | 78.3 out of 100 in July 2026 | Institute of Customer Service |
Read CSAT with three cautions. First, response rates are low, so CSAT describes the customers who answer: "6.7% of chats were rated" on LiveChat, about 15% of chats were rated in one Alibaba study and 17% in the other, and "Approximately 7.5% of sessions were rated" in a 2016 to 2017 telecom chatbot study (Crolic et al., Journal of Marketing, 2022). Second, Freshworks counts a "positive satisfaction score," Gorgias counts 4 or 5 out of 5, and the national indices are 0 to 100 composites, so the numbers aren't on one scale. Third, within one platform, CSAT barely separates good teams from average ones: across 14 ecommerce verticals, "CSAT varies by 0.2 points" on a five-point scale.
National indices move slowly. The ACSI "has not materially increased since 2017," and its Q2 2026 release says the index "declined sharply, the size of which was surpassed only once before in this century," without a published score. The UK index reached 78.3 in July 2026, "a fourth consecutive increase." Forrester's 2024 US CX Index found quality "at an all-time low after declining for an unprecedented third year in a row" (Forrester), and in 2025 "25% of brands’ customer experience rankings declined... compared to only 7% that improved" in the US (Forrester).
Our guides to CSAT in Zendesk and CSAT in Gorgias cover how each help desk calculates it.
Does AI improve or hurt CSAT?
The controlled studies disagree with the vendor surveys, and the difference is whether a human stays in the loop.
- AI assisting a human: flat to slightly better. The NBER study found "no economically significant change in customer satisfaction, as measured by net promoter scores" (2023 working paper; the QJE 2025 version reports the same pattern). Alibaba's drafting assistant reduced the dissatisfaction rate by 3.4% for agents with access. Zhang and Narayandas's study found customer sentiment, scored by the AI tool from the chat's emotional tone, 0.45 points higher on a five-point scale.
- AI working alone: faster, rated lower. In Alibaba's agentic experiment, "customer ratings decline by 0.412 points" on AI-eligible chats, and on chats the AI handled without escalation "they also experience a substantial drop in customer ratings of 0.858 points," while repeat contacts didn't change significantly (arXiv).
- Vendor data: small dips. Gorgias reports "CSAT at 20% automation sits at 87.9%, versus 90.3% at zero."
- Self-reported: CSAT improves. Salesforce's May 2026 survey of 3,075 service professionals says teams that deployed AI agents rank customer satisfaction as "the #1 improved KPI" (Salesforce). That's teams rating their own deployments.
What is a good first contact resolution rate?
For phone support, SQM Group's answer is 70%. "SQM Group’s 2025 research found the aggregated average across all industries for the FCR benchmark is 70%" (SQM Group). Its 2024 benchmark put the average at 69%, with a range from 43% to 88%, and found "only 5% of call centers perform at the world-class FCR rate standard of 80%." SQM measures FCR by surveying customers within one business day of an inbound call, with at least 400 surveys per call center.
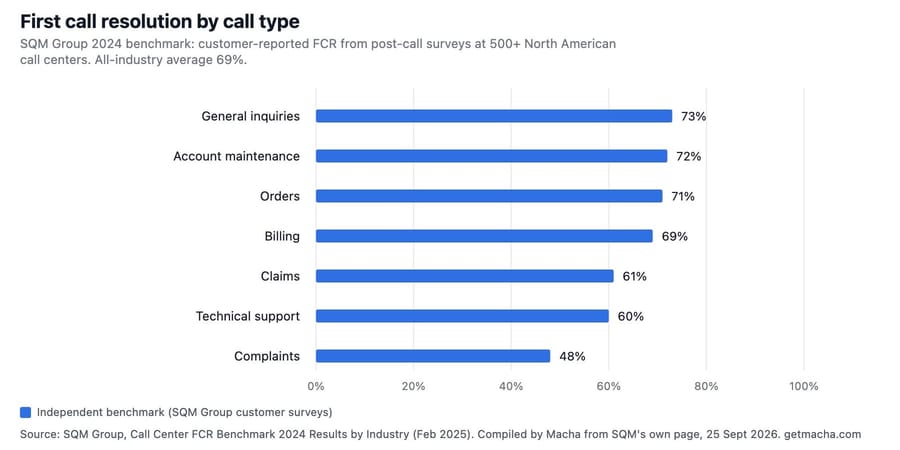
FCR depends heavily on what the call is about: "general inquiries have the highest FCR rate at 73%," while "complaints have the lowest FCR rate at 48%." SQM's rules of thumb, from its own research: "For every 1% improvement in FCR, you reduce your operating costs by 1%," there's "a 1% improvement in customer satisfaction," and "Every 1% improvement in FCR increases transactional Net Promoter Score® by 1.4 points." SQM sells FCR benchmarking, so it has a reason to make FCR the metric that explains everything, and it doesn't publish the regression behind these ratios.
Other FCR figures, and why they don't line up with SQM's:
- Freshworks ticket FCR: 38% top, 18% median, 6% bottom tier. Freshworks defines FCR as the "Percentage of tickets resolved in the first interaction," measured from ticket data. SQM's figure is customer-reported and phone-only. The two aren't comparable.
- Qualtrics (consumer-reported): "Under 2 in 3 issues are resolved in the first call," and "First-call resolution makes customers 2.1x more likely to recommend" (survey of 23,000+ consumers, December 2024; Qualtrics).
- UK Institute of Customer Service (January 2026): 83.2% of customer experiences were right first time, a record high (ICS).
- SQM by channel (2020, older data): "web self-service (76%), IVR self-service (74%), call center (72% and email (61%)" (SQM, 2020).
How much does AI change agent productivity?
The best evidence comes from one peer-reviewed study. Brynjolfsson, Li and Raymond (Quarterly Journal of Economics, 2025) found "Access to AI assistance increases worker productivity, as measured by issues resolved per hour, by 15% on average," with "approximate increase of 30% in the number of issues" per hour for less-skilled and less-experienced workers (QJE; arXiv version). The study covers 5,172 chat agents at one Fortune 500 software company, and the circulating "14% and 34%" figures come from its 2023 working paper. Our staffing statistics cover what that productivity does to headcount.
How to read these numbers
We checked every figure on the publisher's own page or PDF on 25 September 2026 (SQM's pages were read through archived copies because the live site timed out). Three rules:
- Check the population. Freshworks, LiveChat and Gorgias figures describe their own customers, measured on their own platforms. They're large samples, but they're one vendor's customer base each.
- Check the definition. First response time with or without automated replies, FCR from tickets or from customer surveys, CSAT as a percentage or a score: each changes the benchmark.
- Check the date. SQM's 2020 channel figures and the NBER 2023 working paper are older; we've labeled them.
The vendors here have an incentive to publish benchmarks their best customers beat, because a gap between you and the top 20% is the case for their product. We sell AI agents, so we have the same incentive; the studies where AI lowered ratings are on this page for that reason.
Where the data runs out
There's no neutral email first-response benchmark outside vendor platform data. There's no public benchmark of replies per ticket before resolution, or of resolution time by ticket category, and no cross-vendor CSAT on a common scale. For B2B software support specifically, almost nothing is published.
How Macha fits
Macha runs AI agents on top of Zendesk, Freshdesk, Gorgias, Front, HubSpot or Intercom, so its replies show up in the same first-response and resolution-time reports your help desk already produces. It's priced per ticket (one thread between Macha and one person, charged once no matter how many messages it takes). Macha fits teams who want to move first response time and after-hours coverage while keeping a person on the tickets the AI hands off. The pricing page has the tiers, and our guide to Freshdesk metrics covers what to track on one desk.
Sources
- Freshworks, Customer Service Benchmark Report 2025 (1.2 billion tickets, 32,000+ companies, 2024 data; vendor data)
- LiveChat, Customer Service Report (2024; 2 billion chats; vendor data)
- Gorgias Ecom Lab: Stop benchmarking against the average (April 2026), pre-purchase speed (May 2026), after hours (July 2026), support economics (April 2026), AI adoption (April 2026), handoffs (April 2026), channel mix (May 2026); platform data
- SQM Group, Call Center FCR Benchmark 2024 (500+ call centers), FCR guide (November 2025) and Top 5 reasons to improve FCR (2020)
- Qualtrics XM Institute, Contact Center Trends 2025 (December 2024; 23,000+ consumers and 3,072 employees)
- American Customer Satisfaction Index, Q4 2025 national release (February 2026; ~200,000 interviews a year)
- Institute of Customer Service, UKCSI July 2026 (59,500 responses) and January 2026
- Forrester, 2024 US CX Index (98,000+ customers) and 2025 Global CX Index (275,000+)
- Brynjolfsson, Li and Raymond, Generative AI at Work (Quarterly Journal of Economics, 2025; arXiv) and NBER Working Paper 31161 (2023)
- Zhang and Narayandas, Engaging Customers with AI in Online Chats (Management Science, 2026)
- Wang, Zhu, Feng, Lu and Jia, Agentic AI and Human-in-the-Loop Interventions (arXiv preprint, 2026) and Ni et al., Generative AI in Action (arXiv preprint, 2026)
- Crolic, Thomaz, Hadi and Stephen, Blame the Bot (Journal of Marketing, 2022)
- Salesforce, State of Service: AI Agents Edition (May 2026; 3,075)
More statistics
- Customer service and AI statistics (2026): the hub, with the key numbers from every topic.
- What do customers expect from customer service?: stated expectations on speed and repetition.
- How many tickets does AI actually resolve?: AI resolution rates and their definitions.
- How much does customer support cost?: cost per contact and the economics of FCR.
- Ecommerce customer service statistics: delivery problems, returns and pre-purchase questions.
Frequently asked questions
What is the average first response time for customer service? On Freshworks' 2024 data from 1.2 billion tickets, the median ticket first response is 1 hour, and the top 20% of teams reply in 3 minutes 10 seconds. Ecommerce brands on Gorgias have a 6.3-hour median, and LiveChat's chats get a first response in about 35 seconds.
What is a good first contact resolution rate? SQM Group's 2025 research puts the average across industries at 70% for phone support, and only 5% of call centers reach the 80% world-class standard. Freshworks' ticket-based FCR is much lower (18% median) because it's measured differently.
What is the average handle time in a call center? SQM Group's benchmark of 500+ North American call centers found an average of 697 seconds including talk and wrap-up time, up 18% from the previous year. The average LiveChat chat lasts 8 minutes 25 seconds.
What is a good CSAT score? It depends on the scale and the platform. Freshworks' median ticket CSAT is 87.7%, and the top 20% reach 98.9%. LiveChat's rated chats average 64.2%. The US ACSI stood at 76.9 out of 100 in Q4 2025.
Does AI make customer service faster? Yes, in every controlled study we found. AI suggestions cut chat time by 9% in the NBER study, and chats handled entirely by an AI agent were 64.6% shorter in Alibaba's 2026 experiment, though those chats were rated 0.858 points lower on a five-point scale.
To see what an AI agent does to your own response times, start a trial with $50 of free usage (about 125 tickets), no credit card, no time limit.
Resolve tickets automatically with AI agents
Macha's AI agents work on top of the help desk you already use — no code.