



 Intercom
 Shopify
 Stripe
 Slack
Slack Notion
 Google Workspace
 Confluence

Customer Service and AI Statistics (2026): Every Number Checked Against Its Source


Two figures from 2026 sum up where customer service and AI stand. Salesforce's survey of 3,075 service professionals (May 2026) found adoption of AI agents rose from 39% to 66% in a year, while only 24% of the 2,000 consumers surveyed by Ada and NewtonX (March 2026) said their most recent AI customer service interaction was fully resolved by AI alone. Support teams have adopted AI faster than customers have seen it finish the job. This page collects the most useful verified customer service AI statistics on nine topics, each linked to the publisher's own page, with the sample, the date and who was asked.
Key takeaways
- Salesforce's May 2026 survey of 3,075 service professionals found adoption of AI agents in customer service rose from 39% to 66% between 2025 and 2026.
- Only 24% of 2,000 consumers in Ada and NewtonX's March 2026 study said their most recent AI customer service interaction was fully resolved by AI alone.
- Gartner's 2026 survey of 3,566 customers found 87% say companies using GenAI for service must offer an option to reach a human agent.
- Deloitte's 2026 Global Contact Center Survey of 720 leaders put the average cost per assisted contact at $7.80, up from $6.70 in 2024.
- Vendor AI resolution rates run from a 45% median at Gorgias to a 76% average for Intercom's Fin, and each vendor counts a resolution differently, so none of them can be ranked.

The key numbers at a glance
Each row links to the topic page that explains it. Survey figures are what people said; platform figures are what a vendor's system logged. The last column tells you which.
| Statistic | Publisher and report | Date | Sample and who was asked |
|---|---|---|---|
| AI agent adoption rose from 39% to 66% in a year (adoption) | Salesforce, State of Service: AI Agents Edition | May 2026 | 3,075 service professionals |
| Only 10% of teams have reached mature AI deployment (adoption) | Intercom, 2026 Customer Service Transformation Report | Jan 2026 | 2,470 support professionals |
| 24% say AI alone fully resolved their last AI interaction (resolution) | Ada with NewtonX | Mar 2026 | 2,000 consumers |
| 14% of issues fully resolved in self-service (resolution) | Gartner | Aug 2024 | 5,728 customers |
| 87% say a route to a human is essential when companies use GenAI (trust) | Gartner | Aug 2026 | 3,566 customers |
| 84% give a virtual agent three attempts or fewer (trust) | Genesys, State of CX 2026 | Jul 2026 | 5,811 consumers |
| 63% would switch after one bad experience (expectations) | Zendesk, CX Trends 2025 | Nov 2024 | about 5,100 consumers |
| Median ticket first response time of 1 hour (benchmarks) | Freshworks, Customer Service Benchmark Report 2025 | 2025 | platform data, 1.2 billion tickets (vendor data) |
| Average cost per assisted contact $7.80, up from $6.70 (cost and ROI) | Deloitte Digital, 2026 Global Contact Center Survey | Jun 2026 | 720 service leaders |
| 24% of service leaders showed positive financial returns from AI (cost and ROI) | Gartner | Jul 2026 | Service leaders within a survey of 1,303 senior leaders |
| 20% of leaders have reduced agent staffing due to AI (staffing) | Gartner | Dec 2025 | 321 service leaders |
| 51% of service journeys begin on third-party platforms (channels) | Gartner | Jul 2025 | 5,801 customers |
| 74% had a late delivery in the past year (ecommerce) | Narvar, 2025 State of Post-Purchase | Nov 2025 | 3,461 US online shoppers |
How many customer service tickets does AI resolve?
Nobody publishes a neutral, cross-vendor AI resolution rate. The two independent readings come from customers. Ada's study with NewtonX (March 2026, 2,000 consumers and 500 enterprise decision-makers) found "only 24% of consumers say their most recent AI customer service interaction was fully resolved by AI alone" (Ada/NewtonX release). Gartner's survey of 5,728 customers (August 2024) found "Only 14% of customer service and support issues are fully resolved in self-service", and only 36% even for issues customers called very simple. That survey ran in December 2023, before most generative AI agents, so read it as the baseline.
Vendors report much higher numbers from their own platforms. Per Gorgias's own platform data, "the median brand resolves 45% of AI-touched tickets end-to-end" (Gorgias Ecom Lab, April 2026). Per Intercom, Fin is "averaging 76% across 12,000+ customers" (fin.ai), a figure that counts a customer who leaves without asking for more help as resolved. Salesforce completed its acquisition of Fin on 10 September 2026. These rates use different definitions and denominators, which is why the table further down this page exists.
For an operator, the customer-reported numbers and the vendor dashboards measure different events. A vendor logs that a conversation ended without a human; a customer remembers whether the problem went away. When you evaluate an AI agent, decide which of those you're paying for before you look at anyone's rate. The resolution rate statistics page has every vendor figure with its definition, Salesforce's falling series on its own help site, and the field experiments.
How many support teams use AI?
Most of them, by the broadest definition. Salesforce's State of Service: AI Agents Edition (May 2026, 3,075 service professionals) reports that "Adoption of AI agents in customer service organizations increased 1.7x from 2025 to 2026", "rising from 39% to 66%", and 85% of service organizations use at least one form of AI (Salesforce).
Using AI and having it work at scale are different things. Intercom's 2026 Customer Service Transformation Report (2,470 support professionals, January 2026) found 82% of senior leaders invested in AI for customer service in 2025, yet "only 10% of teams report having reached a mature level of deployment" (Intercom). Part of the push comes from above: Gartner's survey of 321 service leaders (October 2025) found "Ninety-one percent of service and support leaders surveyed reported pressure from executive leadership to implement AI" (Gartner, February 2026).
Published adoption figures run from single digits to over 90% depending on whether pilots count and who answers: leaders, agents, or a vendor's platform logs. The adoption statistics page lines them up by definition, including the only split by company size we found.
Do customers trust AI customer service?
Conditionally. The same 5,728-customer Gartner survey as the 14% above (July 2024 release) found "Sixty-four percent of customers would prefer that companies didn't use artificial intelligence (AI) in their customer service" (Gartner). Two years later, Gartner's survey of 3,566 customers found 50% say interactions are easier when companies use GenAI, and "87% of customers say it is essential for companies to provide an option to reach a human agent when using GenAI" (Gartner, August 2026).
Patience is short. Genesys's State of CX 2026 (5,811 consumers, July 2026) found "84% will give a virtual agent three attempts or fewer to resolve an issue" (Genesys). Qualtrics XM Institute's 2026 Consumer Experience Trends (20,000+ consumers, October 2025) found "Nearly one in five consumers who have used AI for customer service saw no benefits from the experience. That's a failure rate almost four times higher than for AI use in general" (Qualtrics).
For a support team, that makes the handoff to a human part of what you're building: customers accept AI that hands off cleanly and leave AI that traps them. The trust statistics page covers escalation, disclosure and second chances in depth, including a 2019 study on what happens when a chatbot discloses it's a bot.
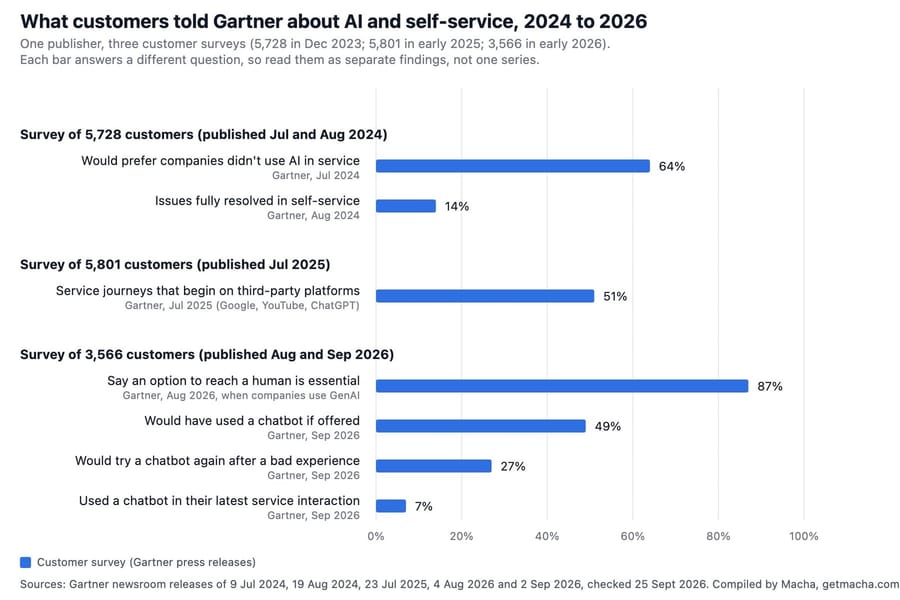
The chart shows one publisher's customer surveys only, so the method is consistent across bars. Two of the bars share the 2024 sample and four share the 2026 sample, so they are not independent confirmations of each other.
What do customers expect from customer service?
Faster answers, and not much tolerance for a bad one. Zendesk's CX Trends 2025 (about 5,100 consumers and 5,400 CX leaders and agents, November 2024) reported "63% willing to switch to a competitor due to just one bad experience" (Zendesk). That is the verified figure behind the widely repeated "73%" claim, which Zendesk's own pages attach to multiple bad experiences, not one.
Other surveys word the question differently and land anywhere from 21% to 73% (our expectations statistics set them side by side). Genesys found "For 21% of consumers, it only takes one bad experience before they switch" (July 2026, from the same survey of 5,811 consumers as the 84% above). The answer depends on how the question is worded, so pick the survey whose wording matches your decision instead of the biggest number. Medallia's 2026 State of CX report (March 2026; 552 practitioners and 1,522 consumers) shows the perception gap in one line: "Although 66% of CX practitioners believe experiences improved last year, only 17% of consumers agree" (Medallia).
The expectations statistics page puts every switching figure side by side with its wording, plus the data on repeating information after a transfer.
What are typical first response and resolution times?
Freshworks' Customer Service Benchmark Report 2025, built on its own platform data from more than 32,000 companies and 1.2 billion tickets in 2024, puts the median ticket first response time at 1 hour, the top 20% at 3 minutes 10 seconds and the bottom tier at 7 hours 4 minutes, with a median resolution time of 6 hours 15 minutes (Freshworks PDF, p.27). That is a vendor's data about its own customers.
Ecommerce runs slower. Per Gorgias's own platform data, "The all-industry median first response time at $10M GMV is 6.3 hours" (Gorgias Ecom Lab, April 2026). For phone support, SQM Group's customer-survey benchmark of North American call centers reports "the aggregated average across all industries for the FCR benchmark is 70%" (SQM Group, 2025). SQM's first call resolution is customer-reported and isn't comparable with ticket-based FCR from help desk data.
Compare yourself with your own channel and vertical, not an all-industry median. The benchmarks page has the full tables for first response time, resolution time, handle time, CSAT and FCR.
How much does customer support cost, and does AI pay back?
Deloitte Digital's 2026 Global Contact Center Survey (720 B2C service leaders and 3,000 consumers, June 2026) put the average cost per assisted contact at $7.80, up from $6.70 in its 2024 survey (Deloitte PDF, p.8). Those are leader-reported averages for mostly large contact centers.
AI isn't free per unit either. Gartner forecasts that "By 2030, cost per resolution for generative AI (GenAI) will exceed $3, higher than many B2C offshore human agents" (Gartner, January 2026). That's a prediction for 2030, not a current price. On returns, Gartner reported in July 2026 that service leaders "invested a median of 12% of their 2025 budget in AI" but "only 24% of service and support leaders demonstrated positive financial returns across their AI use cases" (Gartner).
Today's list prices are a separate question from forecasts. Our AI customer support pricing index records the published price of 32 AI support agents, checked in September 2026, and the cost per resolution breakdown shows what a unit costs once fees are included. Some tools bill for tickets they don't resolve, and a help desk's built-in AI and a standalone agent price very differently. The cost and ROI statistics page covers both sides of the published ROI claims.
Will AI replace customer service agents?
Not so far. Gartner's survey of 321 service leaders (October 2025) found "currently only 20% of leaders have reduced agent staffing due to AI", while "55% report stable staffing levels while handling higher customer volumes" (Gartner, December 2025). That is the same 321-leader survey as the 91% pressure figure above; Gartner has published six releases from it.
The best measured study of AI and support agents is a field study at one Fortune 500 software firm. The peer-reviewed version (Quarterly Journal of Economics, 2025) found AI assistance "increases worker productivity, as measured by issues resolved per hour, by 15% on average" (QJE); the 2023 NBER working paper of 5,179 agents reported "14% on average, including a 34% improvement for novice and low-skilled workers" (NBER). On jobs, Stanford's Digital Economy Lab (August 2026 revision) found "employment of young workers (ages 22–25) in AI-exposed occupations now stands 19% below where it would be had it kept pace with that of their less-exposed peers" (Stanford PDF). Customer service representatives sit in the most exposed group, but the 19% covers all exposed occupations. The often-quoted 13% is the paper's earlier headline.
The staffing statistics page covers headcount plans, attrition and how agent roles are changing.
Where do customers go for help?
Increasingly, somewhere other than you. Gartner's survey of 5,801 customers (July 2025) found "More than half (51%) of all customer service journeys now begin on third-party platforms such as Google, YouTube, and ChatGPT" (Gartner). A year later, Gartner's survey of 3,566 customers found "Customers are approximately three times more likely to use third-party GenAI tools than company-provided chatbots when resolving customer service issues" (Gartner, July 2026). From the same 3,566-customer survey, 49% would have used a company chatbot if offered, but only 7% did in their latest interaction (Gartner, September 2026).
Self-service still underdelivers. In Deloitte's 2026 survey, "70% of consumers said they'd used self-service for support in the prior year. However, those respondents estimated their issues were resolved less than a third of the time via self-service." The self-service and channel statistics page covers phone, chat, email and messaging preferences and why the answers differ by who ran the survey.
What does ecommerce customer service look like?
Mostly delivery problems. Narvar's 2025 State of Post-Purchase report (3,461 US online shoppers, November 2025) found "Seventy-four percent of consumers experienced a late delivery in the past year, and 86% encountered at least one delivery issue" (Narvar).
Speed before the sale matters too. Per Gorgias's own platform data (May 2026), roughly 1 in 9 support inquiries is a pre-purchase question, and when AI handles one "the median first response is 22 seconds. When the same question goes to the human queue, the median first response is 11 hours" (Gorgias Ecom Lab).
We found no verified primary source for the share of ecommerce tickets that are "where is my order" questions. The widely quoted 40% traces to a Forrester figure cited on a vendor blog, not a publication we could read. The ecommerce statistics page covers returns, delivery and post-purchase support.
How do vendors define an AI "resolution"?
Read this before comparing any two AI resolution rates. Each vendor's rate is honest under its own definition; the definitions just don't match.
| Publisher | Term | What counts |
|---|---|---|
| Intercom (Fin) | Resolution rate | The customer confirms, or leaves without asking for more help (an "assumed" resolution after 24 hours). Denominator: conversations Fin was involved in. |
| Zendesk | Automated resolution | Three tiers: assisted escalation (not counted), contained (no further request, but fails an LLM check) and verified (passes an LLM check). |
| Ada | Automated resolution | An LLM grades the conversation as relevant, accurate and safe, with no human. Ada reports containment around 72% against resolution around 52%. |
| Salesforce (Agentforce on Help) | Resolved | The agent answered the customer's inquiry: answered, not confirmed. |
| Gorgias | AI resolution rate, automation rate | Three denominators on its own pages: AI-touched tickets, all tickets in a channel, and billable workload with a 72-hour no-handover rule. |
| Decagon | Deflection | Counted only when the issue is actually resolved; proxy is no human ticket within 24 to 72 hours. |
| Forethought | Deflection | Resolved through any self-service channel (knowledge base, bots, communities) without an agent. |
| Freshworks | Deflection; resolution rate | AI results are labeled deflection; "resolution rate" means tickets closed by anyone. |
| SQM Group | First call resolution | Customer-surveyed: resolved on first contact, no follow-up call. |
| Gartner | Fully resolved in self-service | Customer-reported: the customer didn't move to an assisted channel. |
| Gladly | Resolved | Customer self-report, including hybrid AI-to-human interactions. |
| Salesforce State of Service | Handled vs resolved | Salesforce's own pages use both words for the same 30% survey estimate. |
Zendesk's own guide to the metric warns that "Some platforms even count abandoned chats or incomplete interactions as resolutions, which can make AI performance look stronger than it is" (Zendesk). Several of these vendors also bill per resolution, which makes the definition part of the price list. We don't average, rank or chart these rates against each other anywhere on this site.
Which widely quoted statistics could we not verify?
We traced 27 popular customer service statistics back toward their sources and couldn't confirm them as stated on the publisher's own page. Here are the ones you're most likely to meet, with what the primary actually says.
| What circulates | What we found |
|---|---|
| 73% of consumers leave after one bad experience (Zendesk) | Zendesk's stats page attaches 73% to multiple bad experiences. Its CX Trends 2025 release says 63% after one. |
| Fin resolves up to 50% of questions | Intercom's 2023 launch copy. Intercom later reported 66% (October 2025) and 76% (2026), both counting assumed resolutions. |
| AI will resolve 80% of issues (Gartner) | A forecast: 80% of common issues, by 2029. Gartner's measured figure is 14% fully resolved in self-service (2024). |
| Zendesk AI resolves 80% of interactions | Two different things: a CX Trends expectation among leaders, and a March 2026 press release claim with no stated denominator or method. |
| AI already resolves 30% of cases (Salesforce) | The survey says service teams estimate 30% of cases are handled by AI. It's an estimate of cases handled, not measured resolution. |
| AI will handle 68% of contact center interactions by 2028 (Cisco) | A prediction by B2B technology buyers about their own vendor support interactions, not contact centers generally. |
| 85% of interactions without a human by 2020 (Gartner) | No Gartner publication found. The date has also passed. |
| Salesforce cut support from about 9,000 to 5,000 and saves $100 million | Spoken remarks reported in the press. Salesforce's published pages give conversation counts and resolution rates only. |
| Klarna's AI saved $40 million | Klarna's February 2024 release called it an estimated profit improvement for 2024, one month after launch. |
| Klarna's AI does the work of 853 employees and saved $60 million | Not in Klarna's Q3 2025 release or earnings PDF. The earnings release shows customer service and operations expense rising from $42 million to $50 million. |
| AI resolves 88% of issues (Gladly) | 88% of customers said their issue was resolved "through AI or a hybrid AI-to-human interaction", so it includes handoffs to people. |
| 40% of peak-season contacts are WISMO | Cited to Forrester on a vendor blog. No Forrester primary found. |
| McKinsey: AI raises customer care productivity 30% to 45% | McKinsey's June 2023 report models value at "30 to 45 percent of current function costs", a share of costs, not a measured productivity gain. |
| AI cut young customer service workers' employment by 13% (Stanford) | 13% was the paper's earlier headline. The August 2026 revision says 19%, and it covers all AI-exposed occupations for ages 22 to 25. |
If you've quoted one of these, the primary's own figure is usually just as useful and it will survive a reader checking it.
How we built this page
We started from 102 primary sources (survey reports, press releases, vendor research pages, academic papers) and kept 505 statistics. For each one we saved the publisher's own page or PDF and matched the statistic's text against it word for word. We checked each figure on the publisher's page on 25 September 2026. Where we quote, the wording is the publisher's.
Four rules shape what you see:
- Who was asked is always stated. Consumers, service leaders, agents and platform logs answer different questions. A leader saying AI "improved CSAT" is not a CSAT measurement.
- Vendor self-reports are labeled (per Intercom, or Gorgias's own platform data). A vendor measuring its own product has an incentive to count generously, and a vendor that bills per resolution has a second one.
- Shared samples are flagged. Six Gartner releases from December 2025 to April 2026 come from one survey of 321 service leaders, and three 2026 releases come from one survey of 3,566 customers. They aren't independent confirmations of each other.
- Forecasts carry their target year, and older studies carry theirs. The NBER study (2023) and McKinsey's report (2023) are landmark references, not current measurements.
We sell AI agents, so we have our own incentive to prefer flattering numbers. That's why this hub quotes primaries only and keeps the figures that cut against AI: the 24%, the 14%, the 64%, and the 24% of leaders who can show a financial return.
Where the data runs out
Three gaps matter most. There's no neutral, cross-vendor measurement of AI resolution rates, and nothing that breaks resolution down by ticket type. There's no public cost-per-ticket benchmark for small email and ecommerce support teams; the published cost figures come from large contact centers. And there's no verified figure for the share of ecommerce tickets that are order-status questions. Most consumer attitude data is also from US or global online panels, and nearly all of it is what people say, not what they did.
When we find a primary that fills one of these gaps, we'll add it here and to the topic page, with the date we checked it.
How Macha fits
Macha runs AI agents on top of Zendesk, Freshdesk, Gorgias, Front, HubSpot or Intercom, inside the ticket queue a support team already has, priced per ticket (one thread between Macha and one person, charged once no matter how many messages it takes; see pricing). Because the price doesn't depend on a resolution, we don't need a generous definition of one, and we'd rather you measure it yourself on your own tickets. Macha fits teams already on one of those help desks who want to test AI against their real queue before committing. None of the statistics on this page come from Macha.
Sources
- Ada and NewtonX, Ada Study Finds Consumers Prefer "Always-On" AI Customer Service (March 2026; 2,000 consumers, 500 enterprise decision-makers)
- Deloitte Digital, 2026 Global Contact Center Survey (June 2026; 720 B2C service leaders, 3,000 consumers)
- Freshworks, Customer Service Benchmark Report 2025 (2025; platform data, 32,000+ companies, 1.2 billion tickets; vendor data)
- Gartner, 64% of Customers Would Prefer That Companies Didn't Use AI (July 2024; 5,728 customers)
- Gartner, Only 14% of Customer Service Issues Are Fully Resolved in Self-Service (August 2024; 5,728 customers)
- Gartner, More Than Half of Customer Service Journeys Now Start on Third-Party Platforms (July 2025; 5,801 customers)
- Gartner, Only 20% of Customer Service Leaders Report AI-Driven Headcount Reduction (December 2025; 321 leaders)
- Gartner, GenAI Cost Per Resolution Will Exceed Offshore Human Agent Costs by 2030 (January 2026; forecast)
- Gartner, 91% of Customer Service Leaders Under Pressure to Implement AI in 2026 (February 2026; same 321 leaders)
- Gartner, Customers Are 3x More Likely to Use Third-Party GenAI Than Company-Provided Chatbots (July 2026; 3,566 customers, 1,303 senior leaders)
- Gartner, 87% of Customers Say Companies Using GenAI Must Provide Access to a Human Agent (August 2026; same 3,566 customers)
- Gartner, Only 27% of Customers Would Try a Chatbot Again After a Negative Experience (September 2026; same 3,566 customers)
- Genesys, State of Customer Experience 2026 (July 2026; 5,811 consumers, 1,560 leaders)
- Gorgias Ecom Lab, The cheapest ticket is the one a human never touches (April 2026), Stop benchmarking against the average (April 2026) and Pre-purchase speed is a revenue lever (May 2026) (Gorgias platform data; vendor data)
- Intercom, 2026 Customer Service Transformation Report (January 2026; 2,470 support professionals) and Fin homepage (2026; vendor data)
- Medallia, 2026 State of CX Report (March 2026; 552 practitioners, 1,522 consumers)
- Narvar, 2025 State of Post-Purchase Report (November 2025; 3,461 US online shoppers)
- NBER (Brynjolfsson, Li and Raymond), Generative AI at Work (working paper, 2023; 5,179 agents); peer-reviewed in the Quarterly Journal of Economics (2025)
- Qualtrics XM Institute, 2026 Consumer Experience Trends (October 2025; 20,000+ consumers)
- Salesforce, State of Service: AI Agents Edition (May 2026; 3,075 service professionals)
- SQM Group, First Call Resolution: A Comprehensive Guide (2025; 500+ North American call centers)
- Stanford Digital Economy Lab, Canaries in the Coal Mine? (August 2026 revision; ADP payroll records)
- Zendesk, CX Trends 2025 (November 2024; about 10,500 respondents) and AI resolution rate guide
More statistics
- How many tickets does AI actually resolve?
- How many support teams use AI?
- Do customers trust AI customer service?
- What do customers expect from customer service?
- What are typical response time, resolution time, CSAT and FCR benchmarks?
- How much does customer support cost, and what is the ROI of AI?
- Will AI replace customer service agents?
- Where do customers go for help?
- What does ecommerce customer service look like?
Frequently asked questions
What percentage of companies use AI in customer service? Salesforce's State of Service: AI Agents Edition (May 2026, 3,075 service professionals) found 85% of service organizations use at least one form of AI and 66% use AI agents, up from 39% a year earlier. Intercom's January 2026 report found only 10% of teams have reached a mature deployment.
How many customer service issues does AI resolve? There's no neutral cross-vendor figure. In Ada and NewtonX's March 2026 study, 24% of 2,000 consumers said their most recent AI interaction was fully resolved by AI alone. Vendors report 45% (Gorgias median, AI-touched tickets) to 76% (Intercom's Fin average, including assumed resolutions), each under its own definition.
Do customers prefer AI or human customer service? Most want a human available. Gartner's 2024 survey of 5,728 customers found 64% would prefer companies didn't use AI for service, and its 2026 survey of 3,566 customers found 87% say companies using GenAI must offer a route to a human agent.
What is the average cost of a customer service contact? Deloitte Digital's 2026 Global Contact Center Survey of 720 leaders put the average cost per assisted contact at $7.80, up from $6.70 in 2024. Those are mostly large contact centers; there's no public equivalent for small email-first teams.
Is AI replacing customer service jobs? Not widely yet. Gartner's October 2025 survey of 321 service leaders found only 20% had reduced agent staffing due to AI, while 55% kept staffing stable as volumes grew. Stanford's August 2026 revision found employment of 22 to 25 year olds in AI-exposed occupations 19% below trend.
Why do AI customer service statistics disagree so much? Because they measure different things. Some ask consumers, some ask leaders, some count a vendor's own platform logs, and vendors define a resolution differently. Check who was asked, what the denominator is, and whether the figure is a forecast.
To see how AI does on your own queue, start a trial with $50 of free usage (about 125 tickets), no credit card, no time limit.
Resolve tickets automatically with AI agents
Macha's AI agents work on top of the help desk you already use — no code.