



 Intercom
 Shopify
 Stripe
 Slack
Slack Notion
 Google Workspace
 Confluence

Ecommerce Customer Service Statistics (2026): WISMO, Returns and Post-Purchase Support


Seventy-four percent of US online shoppers had a late delivery in the past year and 86% hit at least one delivery issue, according to Narvar's 2025 State of Post-Purchase Report, a survey of 3,461 shoppers published in November 2025. That is the raw material of ecommerce support: late parcels, missing parcels, returns and refunds. No one has published a verified share of ecommerce tickets that are "where is my order" (WISMO) questions. This page collects the ecommerce customer service statistics that do exist on delivery problems, returns, tickets per order, pre-purchase questions and AI, each with its publisher, date and sample, and says plainly where the data stops.
Key takeaways
- Narvar's 2025 State of Post-Purchase survey of 3,461 US online shoppers found 74% had a late delivery in the past year and 86% had at least one delivery issue.
- No verified primary source gives the share of ecommerce support tickets that are WISMO questions; the widely repeated 40% traces to a Forrester figure quoted on a Narvar blog.
- In a field study of Alibaba's Taobao marketplace (2024 data, 2026 preprint), order-related after-sales issues such as returns, refunds, exchanges and shipping fees made up 56.5% of all customer service chats.
- Gorgias's own platform data shows Electronics brands get about 46 support tickets per 100 orders and Food & Beverages brands about 20.
- Per Gorgias's platform data, roughly 1 in 9 ecommerce support inquiries is a pre-purchase question, and the median brand receives 53% of those outside business hours.

How often do deliveries go wrong for online shoppers?
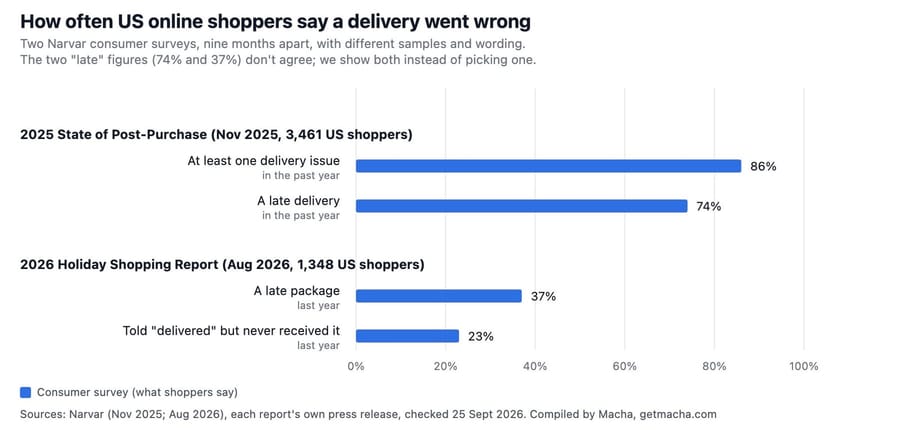
Most of the time, if you ask shoppers about a whole year. Narvar's 2025 State of Post-Purchase Report (US, 3,461 online shoppers surveyed in August 2025, plus platform data from Narvar's retailer network) found "Seventy-four percent of consumers experienced a late delivery in the past year, and 86% encountered at least one delivery issue" (Narvar, November 2025). The same survey says two-thirds of shoppers feel anxious after they click buy. This page is one topic in our customer service and AI statistics hub. Here's the rest of what Narvar's surveys say.
| Stat | Publisher and report | Date | Who was asked |
|---|---|---|---|
| 74% had a late delivery in the past year; 86% at least one delivery issue | Narvar, 2025 State of Post-Purchase | Nov 2025 | 3,461 US online shoppers |
| Shoppers want acknowledgement (46%), clear explanations (46%) and real-time updates (45%) when an issue occurs | Same survey | Nov 2025 | 3,461 US online shoppers |
| 38% say frequent tracking updates reduce anxiety; nearly half prefer SMS, push or WhatsApp for urgent updates | Same survey | Nov 2025 | 3,461 US online shoppers |
| 73% say estimated delivery dates influence purchase; 40% won't buy if no date is shown | Same survey | Nov 2025 | 3,461 US online shoppers |
| 37% had a late package last year; 23% were told a package was delivered when it never arrived | Narvar, 2026 Holiday Shopping Report | Aug 2026 | 1,348 US shoppers planning to shop online for the holidays |
The two "late" figures don't agree. The 2025 report says 74% had "a late delivery in the past year"; the 2026 holiday report, nine months later, says "37% experienced a late package last year, and 23% were told a package had been delivered when they never received it." Different samples, different wording, and Narvar doesn't reconcile them. We show both. If you need one number for a slide, the honest version is a range: between a third and three-quarters of US online shoppers, depending on which Narvar survey you use.
Narvar sells delivery-date estimates, tracking pages, notifications and returns software, so a survey that finds shoppers anxious after checkout is a survey that finds demand for its products. The numbers can still be right, but Narvar doesn't publish its question wording in the releases, so we can't check how "delivery issue" was defined.
For a support team, the timing line is the one to act on. Shoppers want acknowledgement, an explanation and updates "before they have to ask." Every late parcel you notify about first is a ticket that doesn't arrive. Our guide to proactive shipping updates in Gorgias walks through one way to do it.
What share of ecommerce support tickets are "where is my order" questions?
There is no verified answer. We looked for a primary source for the WISMO share of ecommerce contacts and didn't find one.
The figure that circulates is about 40%. It traces to a Narvar blog post: "According to Forrester, nearly 40% of all customer service contacts during peak season are WISMO inquiries" (Narvar blog). That's Narvar quoting Forrester, about peak season only, and we couldn't locate the Forrester publication behind it. None of the Narvar reports we read (State of Post-Purchase 2025, State of Returns 2024, the 2026 holiday report) gives a WISMO share of contacts. Treat 40% as unverified.
Here's what the primaries do say, from the most to the least general:
| Stat | Publisher | What it measures | Why it isn't a WISMO share |
|---|---|---|---|
| Order-related after-sales issues are 56.5% of all customer service chats | Ni et al. with Alibaba, arXiv preprint (2026; Taobao, 2024 fieldwork) | Exchanges, returns, refunds, repairs and shipping-fee questions on Taobao | One Chinese marketplace; mixes returns and refunds with shipping; excludes pre-sale chats |
| "75% of the requests are common issues like missing orders or return requests" | Sierra, OluKai customer story (undated) | A support supervisor's estimate at one footwear brand | Single customer, vendor case study, no method |
| Roughly 1 in 9 support inquiries is pre-purchase | Gorgias Ecom Lab, platform data (May 2026) | Pre-purchase intent across Gorgias brands | The other eight in nine aren't broken down |
The Taobao study is the only one with a measured denominator. The authors focus on order-related after-sales chats and write: "These issues account for 56.5% of all customer service chats." It's a peer-review-pending preprint from one marketplace in China, so it tells you that post-purchase issues can be the majority of contacts, not what your store's mix is. Taobao also routes shoppers through a chatbot tier first, and the study's data are the chats that reached human agents. The same study found "38% of customers recontacted the platform for the same issue within three days", a repeat-contact rate worth knowing if your WISMO replies send people away without a date.
Gorgias frames the remainder of its volume as post-purchase work, listing "Order status, returns, shipping, account changes" as what CX teams are built to handle, but it doesn't publish the split between them.
For an operator, the only WISMO share you can trust is your own. Tag a month of tickets by intent (order status, return, refund, damaged or missing item, pre-purchase, other) and you'll have a better number than any published one. Once you know it, auto-resolving order-status questions in Gorgias is a common first automation, because the answer lives in the order record.
How many support tickets does an online store get per order?
It depends on what you sell. Per Gorgias's own platform data (April 2026, merchants with at least 30 tickets across 14 verticals), "An Electronics brand generates about 46 support tickets for every 100 orders, nearly one ticket for every two orders. A Food & Beverages brand generates about 20, roughly one in five" (Gorgias Ecom Lab). Gorgias defines the metric plainly: "Tickets per 100 orders measures support volume relative to order volume."
The arithmetic at 10,000 orders a month:
| Vertical | Tickets per 100 orders | Tickets a month at 10,000 orders | Of which pre-purchase (about 1 in 9) |
|---|---|---|---|
| Electronics | about 46 | about 4,600 | about 510 |
| Food & Beverages | about 20 | about 2,000 | about 220 |
That 2.3x gap is why a single "tickets per order" benchmark is misleading. The 1-in-9 pre-purchase share is a platform-wide figure, so applying it per vertical is our approximation. It's Gorgias's platform data only, which skews toward Shopify-based direct-to-consumer brands.
Most of those tickets still arrive by email. Per Gorgias's matched cohort of 10,990 brands (May 2026), "85% of brands still run support primarily through email," and "Email volume on the same brands is roughly flat over two years. Chat is up 47%. WhatsApp 153%" (Gorgias Ecom Lab). Half of active brands have less than 2% of their volume on chat. Our self-service and channel statistics cover channel preference outside ecommerce.
How do returns show up in customer service?
As a steady monthly load. Narvar's State of Returns 2024 (a randomized survey of 1,924 US consumers aged 18 to 75, August 2024) found "nearly 39% of consumers now return items purchased online at least once a month" (Narvar via PR Newswire). The same release says "60% of consumers are open to exchanges or store credit instead of full refunds if the process is quick and convenient."
- Refund timing blocks sales. In Narvar's 2026 holiday survey of 1,348 shoppers, "56% of consumers have delayed or avoided a purchase because they were uncertain how long a refund might take."
- Delivery is a named cause of bad experiences. Qualtrics XM Institute's 2025 Consumer Trends survey of nearly 24,000 consumers in 23 countries (October 2024) found "Service delivery issues (selected in 46% of bad experiences)" (Qualtrics).
- Returns sit inside the Taobao 56.5%. Alibaba's after-sales category bundles returns, refunds and exchanges with shipping fees, so the study can't separate them.
Two things follow for a support team. A return or refund question is often asked before the purchase (Gorgias's example: "What is the return window if it does not fit?"), so a clear policy answered fast protects the sale as well as the ticket queue. And the 60% open to an exchange is an argument for offering the exchange in the first reply. Our walkthrough of automating returns in Gorgias shows the mechanics.
We left out Narvar's 2024 return-fraud figure: its November 2025 release says the share of shoppers admitting return fraud fell sharply, so the 2024 number is out of date.
Why do pre-purchase and after-hours questions matter more in ecommerce?
Because they arrive when nobody is working, and they come before the money. Per Gorgias's platform data (July 2026), "the median brand takes 53% of its pre-purchase questions outside business hours. One in five lands on a weekend" (Gorgias Ecom Lab). Business hours here means Monday to Friday, 9am to 6pm on the merchant's local clock. The hub shows the 22-second versus 11-hour first-response gap on those questions, and our customer service benchmarks page has the full response-time tables, so we won't repeat them here.
What Gorgias reports on the revenue side, all of it its own platform data:
- After-hours revenue. "55% of AI-assisted revenue comes from conversations that start after hours."
- Self-resolution after hours. "After hours, Shopping Assistant resolves 91% of pre-purchase conversations on its own," counted as closed with no human handover.
- Order value. "Average order value on AI-influenced pre-purchase orders is 45% higher than the site average on the same brands" (Gorgias, May 2026).
- Conversion. Shoppers who have a conversation with AI Agent or a human "have a 154% higher conversion rate than those who don’t" (Gorgias State of Conversational Commerce 2026).
Read the order-value and conversion figures with the incentive in view. Gorgias sells the Shopping Assistant these numbers describe, and it earns more when brands turn it on. To its credit, Gorgias states the catch in its own methodology: the order-value lift "is associative attribution, not proof of cause, and higher-intent shoppers self-select into the assistant." A shopper who opens a chat on a product page was more likely to buy and to buy more anyway. The 53% after-hours share is the sturdier figure, because it's a timestamp count with no attribution model behind it.
How much ecommerce support do AI agents handle?
Brands say about a third. Gorgias's State of Conversational Commerce 2026, a survey of 400 ecommerce decision-makers in the US, UK and Europe (fieldwork October to November 2025, 40% of respondents in fashion and apparel), found "AI currently handles an average of 31% of customer interactions for ecommerce brands and is expected to reach nearly 50% within the next two years" (Gorgias). From the same survey, "86% of brands report that at least a quarter of AI conversations eventually involve a human."
Platform data answers a different question: how many brands run AI at all. Per Gorgias's own measurement of which brands have AI live, "roughly 1 in 5 brands has deployed AI in customer-facing support," from under 18% of brands below $1M in GMV to close to 50% above $500M (Gorgias Ecom Lab, April 2026). Our AI adoption statistics put that against cross-industry surveys.
Vendor rates for retail and ecommerce, each under its own definition. They aren't comparable, and we don't rank them:
| Vendor figure | Publisher | What counts |
|---|---|---|
| One in four chat tickets and one in 26 email tickets resolved by AI | Gorgias, channel data (May 2026) | AI-Agent-billed tickets over all tickets in the channel |
| 53% in retail | Freshworks, Benchmark Report 2025 (2024 data) | Labelled "deflection" in the report; Freshworks' ROI page restates it as resolved |
| 80-85% or higher for the best retail and ecommerce customers | Ada, automated resolution guide (June 2026) | LLM-graded resolution on "high-volume transactional use cases," best customers only |
| About 70% | Sierra, OluKai story | One brand: "able to resolve a ticket or inquiry without human intervention" |
The Gorgias channel figure is the one to plan around, because it shows where AI actually lands in ecommerce today: chat, far more than email, while 85% of brands are email-first. When AI does hand off, the handoff often fails. Per Gorgias, "33% of handed-off tickets are abandoned and never receive a human response" (Gorgias Ecom Lab, April 2026). Our AI resolution rate statistics break these definitions down further.
Shoppers say they'll accept AI for order tracking:
- Zendesk CX Trends 2025 (nearly 5,100 consumers, 22 countries, November 2024): "Sixty-seven percent of consumers are ready to delegate tasks like tracking orders and receiving personalized recommendations to AI" (Zendesk).
- Kustomer (1,200 US consumers, September 2024): "78% of respondents willing to interact with AI agents, especially for routine tasks like order tracking and service cancellations" (Kustomer).
- Talkdesk's one-day poll of 1,000 US holiday shoppers (January 2026) found 45% used AI to track holiday shipments; from the same poll, 31% who spoke with a retail service rep weren't sure whether it was AI or a human (Talkdesk).
- Narvar's 2026 holiday survey: 15% plan to use AI "for managing what happens after checkout, including package tracking and return reminders."
- Klaviyo (7,998 consumers in eight countries, March 2026): 85% at least somewhat trust AI for shopping recommendations, but "only 54% trust AI to provide good support via conversational agents" (Klaviyo).
Acceptance runs highest in these surveys when the task is a lookup with a factual answer, and lower for support in general (Klaviyo's 54%). They're different surveys asking different questions, so read that as a pattern across them. Our customer trust statistics cover the wider attitude data.
How to read these numbers
We checked every figure on the publisher's own page, PDF or press release on 25 September 2026. Four kinds of evidence sit on this page, and they aren't interchangeable:
- Consumer surveys (Narvar, Qualtrics, Zendesk, Kustomer, Talkdesk, Klaviyo) report what shoppers say. Several stats come from one survey: the first four Narvar table rows share the 3,461-shopper sample, and the 37%, 23%, 56% and 15% figures share the 1,348-shopper holiday sample.
- A brand survey (Gorgias State of Conversational Commerce, 400 decision-makers) reports what brands estimate about their own AI. The 31% is an estimate, and the survey skews toward apparel.
- Vendor platform data (every Gorgias Ecom Lab figure, Freshworks, Ada, Sierra) describes each vendor's own customers under its own definitions. Gorgias's research pages use different AI denominators (all tickets in a channel, AI-touched tickets, all billable workload), so its AI figures don't add up across pages.
- A field study (Alibaba's Taobao) measures real chats with a stated denominator, in one marketplace, in 2024.
Every vendor here sells something the numbers support: Narvar sells post-purchase software, Gorgias sells AI agents on its help desk, and Klaviyo, Kustomer and Talkdesk all sell AI for customer service. We sell AI agents too, so we have our own reason to prefer flattering numbers. That's why this page quotes primaries only and keeps the figures that cut the other way: the 33% of handoffs that go unanswered, and the missing WISMO share.
Where the data runs out
- The WISMO share of tickets. No verified primary exists. The 40% figure is a secondhand Forrester citation about peak season.
- Returns as a share of support volume. Taobao bundles returns with refunds, exchanges and shipping; nobody publishes returns alone for western ecommerce.
- Contact rates outside one platform. Tickets per 100 orders comes only from Gorgias's customer base.
- Cost per ecommerce ticket. No public benchmark for small ecommerce teams; see our cost and ROI statistics for what exists at contact-center scale.
- Measured AI resolution by ticket type. Nobody publishes how often AI resolves order-status tickets versus return or damaged-item tickets.
How Macha fits
Macha runs AI agents on top of Zendesk, Freshdesk, Gorgias, Front, HubSpot or Intercom, priced per ticket (one thread between Macha and one person, charged once no matter how many messages it takes). Macha fits teams already running Zendesk, Freshdesk, Gorgias, Front, HubSpot or Intercom with a Shopify store who want order-status, return and refund tickets answered inside the ticket, with the agent looking up the order in Shopify before it replies and issuing a refund there when your instructions allow it. It's the wrong fit if you want a separate chat widget with its own inbox: handoffs land in the queue your team already works. The pricing page lists the tiers.
Sources
- Narvar, 2025 State of Post-Purchase Report (November 2025; 3,461 US online shoppers plus Narvar platform data)
- Narvar, 2026 Holiday Shopping Report (August 2026; 1,348 US consumers and 100 retail decision-makers)
- Narvar, State of Returns 2024 (August 2024; 1,924 US consumers)
- Narvar, blog post citing Forrester on WISMO (cited only to show the 40% is unverified)
- Ni, Wang, Feng, Lu, Wang and Zhou, with Alibaba, Generative AI in Action: Field Experimental Evidence from Alibaba's Customer Service Operations (arXiv preprint, July 2026 version; about 2.56 million chats, 5,940 agents)
- Sierra, OluKai customer story (undated; single customer)
- Gorgias Ecom Lab: Stop benchmarking against the average (April 2026), AI is everywhere (April 2026), The cheapest ticket is the one a human never touches (April 2026), Email isn't dying, chat is doubling (May 2026; 10,990 brands), Pre-purchase speed is a revenue lever (May 2026), Your team is sleeping on 53% of shopper questions (July 2026); all vendor platform data
- Gorgias, The State of Conversational Commerce in 2026 (fieldwork October to November 2025; 400 ecommerce decision-makers plus Gorgias platform data)
- Freshworks, Customer Service Benchmark Report 2025 (2024 data; vendor platform data)
- Ada, What is automated resolution? (June 2026; Ada customer deployments)
- Qualtrics XM Institute, 2025 Consumer Trends (October 2024; nearly 24,000 consumers)
- Zendesk, CX Trends 2025 (November 2024; nearly 5,100 consumers and 5,400 CX professionals)
- Kustomer, 2024 AI Agent and Customer Service Index (September 2024; 1,200 US consumers)
- Talkdesk, Post-2025 Holiday Shopping Survey (January 2026; 1,000 US consumers)
- Klaviyo, 2026 AI Consumer Trends (March 2026; 7,998 consumers)
More statistics
- Customer service and AI statistics (2026): the hub, with the key numbers from every topic.
- What are good customer service benchmarks for response and resolution time?
- How many tickets does AI actually resolve?
- Where do customers go for help?
- Do customers trust AI customer service?
Frequently asked questions
What percentage of ecommerce customer service tickets are WISMO? No verified primary source publishes it. The widely quoted figure, nearly 40% of contacts during peak season, is a Forrester number cited on a Narvar blog, and we couldn't find the Forrester original. The nearest measured figure is from Alibaba's Taobao, where order-related after-sales issues, including returns and refunds, made up 56.5% of customer service chats.
How many online shoppers have delivery problems? In Narvar's 2025 State of Post-Purchase survey of 3,461 US online shoppers, 74% had a late delivery in the past year and 86% had at least one delivery issue. Narvar's 2026 holiday survey of 1,348 shoppers put late packages at 37% and false "delivered" notices at 23%.
How many support tickets does an ecommerce store get per order? Per Gorgias's own platform data from April 2026, Electronics brands get about 46 tickets per 100 orders and Food & Beverages brands about 20. At 10,000 orders a month that's roughly 4,600 or 2,000 tickets.
How often do online shoppers return items? Narvar's State of Returns 2024 survey of 1,924 US consumers found nearly 39% return online purchases at least once a month, and 60% are open to an exchange or store credit if the process is quick.
How much ecommerce support does AI handle? Ecommerce decision-makers in Gorgias's 2026 survey of 400 brands estimate AI handles 31% of customer interactions. Gorgias's platform data shows about 1 in 5 brands with customer-facing AI live, and AI resolving one in four chat tickets but only one in 26 email tickets.
To see what share of your own tickets are order status, returns and refunds, and how many an AI agent can answer, start a trial with $50 of free usage (about 125 tickets), no credit card, no time limit.
Resolve tickets automatically with AI agents
Macha's AI agents work on top of the help desk you already use — no code.